Stock MarketMarket HistoryValuationAI
Secular Bull Market or Late-Stage Bubble? What 100 Years of Market History Says About Today
Prefer to listen? This one’s an episode too.
Paycheck Paradox podcast · 18:07
Secular Bull Market or Late-Stage Bubble? What 100 Years of History Says About Today
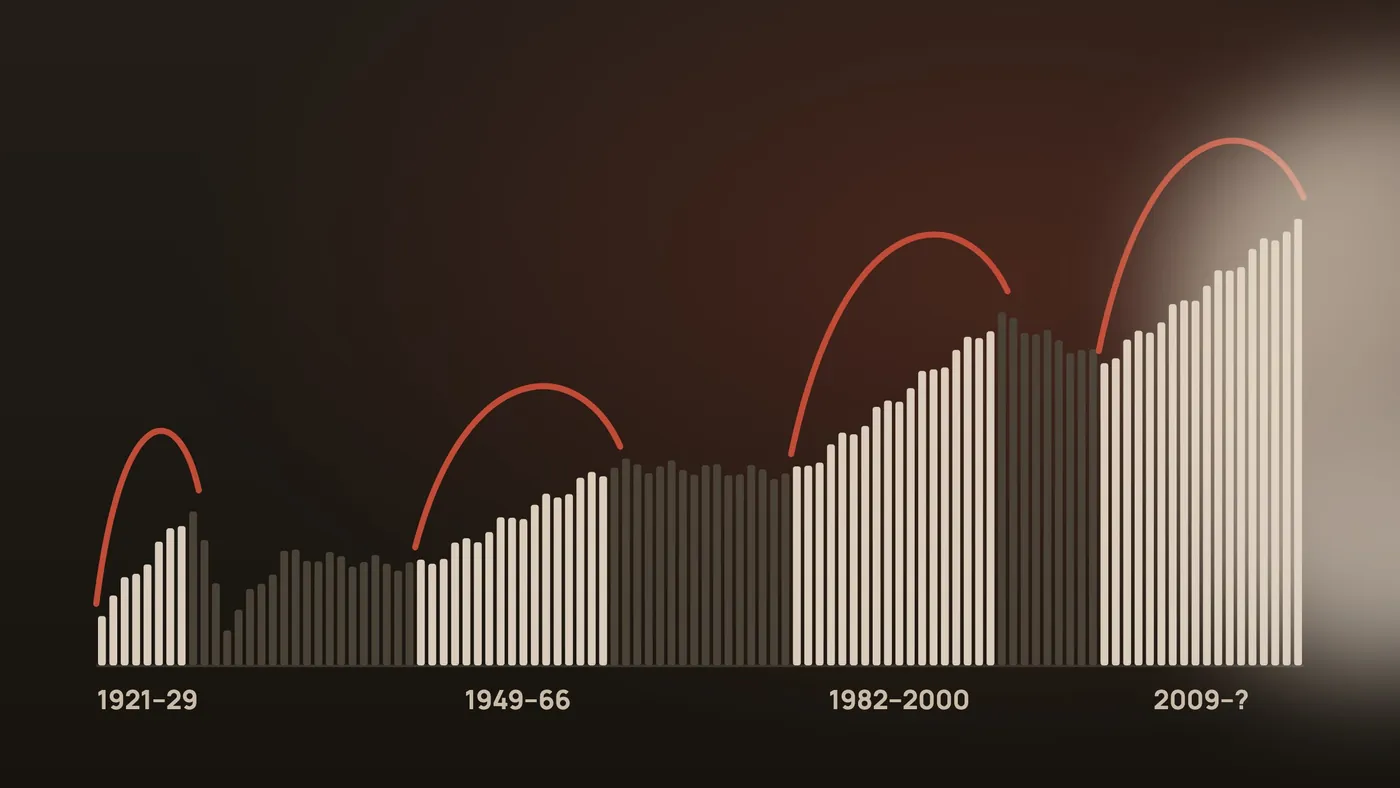
The short version: Stocks have gone through a handful of giant, decades-long cycles. Long stretches of rising prices, called secular bull markets, alternate with long stretches where prices go nowhere or fall. The three great bull markets of the last century lasted about 8, 17 and 18 years, and each one ended the same way: very expensive stocks, then rising inflation or interest rates, then a crash or a long slump. Today, one of the best long-term valuation measures, the Shiller CAPE ratio, is around 40, its second-highest reading ever, just below the 1999 dot-com peak of about 44. At the same time, record IPOs are coming to market, the Fed is raising rates, and companies are borrowing at a record pace. That doesn’t prove a crash is coming. But it does mean today looks a lot more like the end of a secular bull market than the beginning of one.
Two kinds of bull markets
When most people say “bull market,” they mean a cyclical bull market: a rise of 20% or more from a recent low, usually lasting a few years. The current one, by most counts, began in October 2022.
A secular bull market is something bigger. It’s a long trend, usually 15 years or more, where stocks rise far faster than normal, and the drops along the way (even scary ones) turn out to be temporary. A secular bull market can hold several cyclical bull and bear markets inside it, the way a rising tide holds many waves.
The opposite is a secular bear market: a long period, often 15 to 20 years, where stocks go roughly nowhere after inflation, with big rallies that keep fizzling. Investors who bought at the start of one of these waited a very long time to come out ahead.
The simplest way to tell them apart:
| Secular bull | Secular bear | |
| Typical length | About 15 to 18 years | About 15 to 20 years |
|---|---|---|
| What stocks do | Rise far faster than the economy | Go roughly sideways, or fall after inflation |
| Where it starts | Cheap stocks, gloomy investors | Expensive stocks, confident investors |
| Where it ends | Expensive stocks, euphoric investors | Cheap stocks, investors who’ve given up |
That last row is the key idea of this article. Secular bull markets don’t die of old age. They die of high prices, usually once something like inflation, rising interest rates or a debt problem gives investors a reason to stop paying them.
The Shiller CAPE: the market’s long-term price tag
The measure everyone brings up in these debates is the Shiller CAPE ratio, short for cyclically adjusted price-to-earnings ratio. It was popularized by Yale economist Robert Shiller, who used it to warn about stocks in his book Irrational Exuberance, published in March 2000, right at the top of the dot-com bubble.
A normal price-to-earnings (P/E) ratio compares the stock price to one year of profit. The trouble is that one year can be unusual: profits collapse in a recession and spike in a boom. The CAPE fixes that by comparing the S&P 500’s price to the average of the last 10 years of earnings, adjusted for inflation. It smooths out the business cycle and asks a simple question: how much are investors paying for a decade’s worth of normal profits?
Some reference points (approximate, from Shiller’s data):
| Moment | Shiller CAPE |
| Long-term average, since the 1880s | About 17 |
|---|---|
| 1982, the start of the 1980s and 90s bull market | About 7 |
| 2009, the bottom of the financial crisis | About 13 |
| September 1929, before the Great Crash | About 32 |
| January 1966, end of the postwar bull market | About 24 |
| December 1999, the dot-com peak (all-time high) | About 44 |
| November 2021, before the 2022 bear market | About 38 |
| November 2026 (today) | About 38 to 41, depending on the day and source |
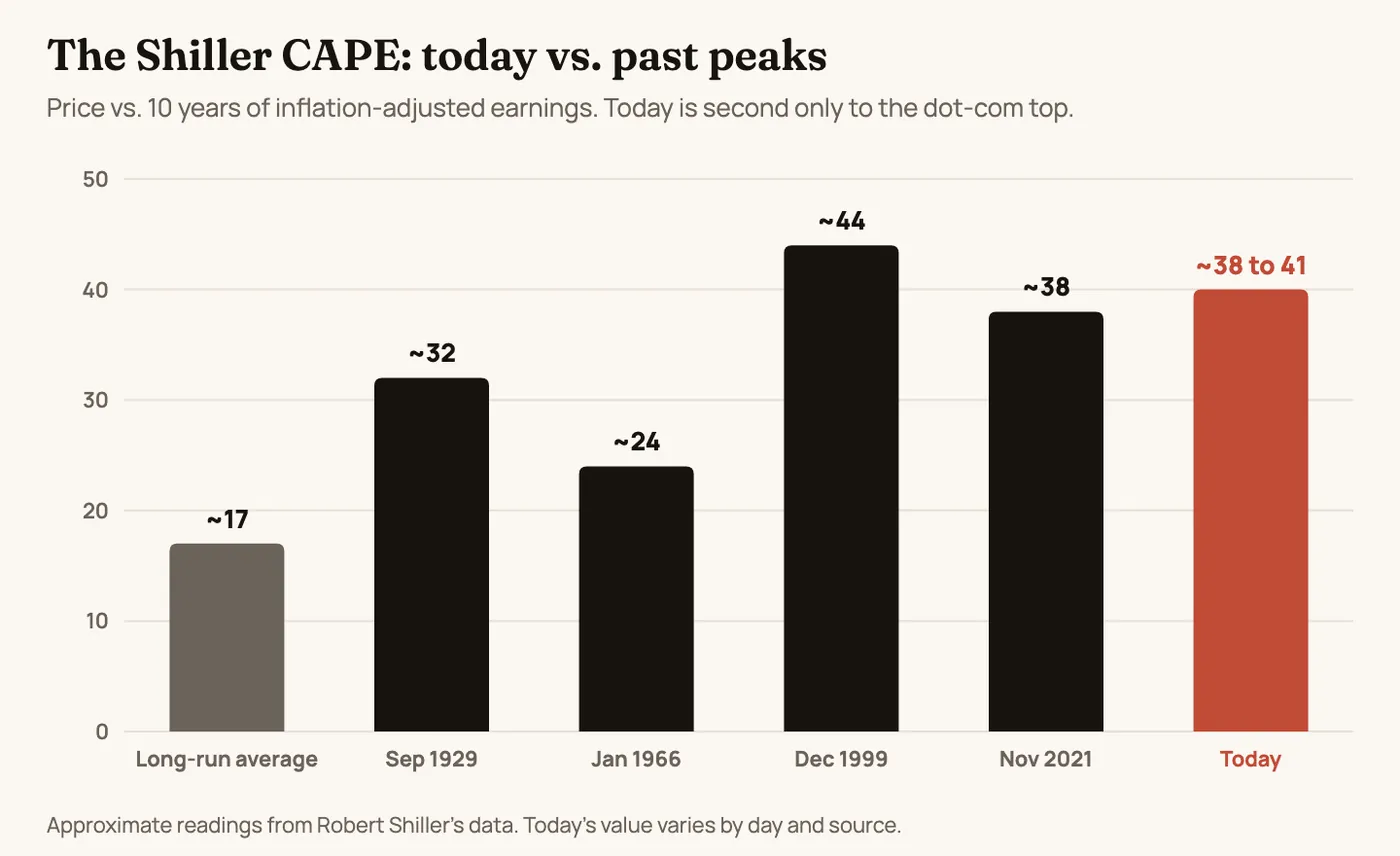
So no, today’s reading is not above 1999’s. But it’s close: the second-highest ever. Readings above 40 this year were the first since the dot-com era.
Two other measures tell a similar story. The Buffett indicator (the total value of US stocks divided by the size of the economy) hit a record of about 230% in mid-2026, against a long-run average near 88%. And the 10 biggest stocks make up somewhere around 35% to 40% of the S&P 500, near the highest share in decades.
What the CAPE can and can’t tell you
The CAPE has a strong record of predicting the next 10 years of returns. When it has been very high, the following decade has usually been disappointing; when it has been very low, the following decade has usually been great. Buying in 1982 at a CAPE of 7 set up spectacular returns. Buying in late 1999 at 44 meant the S&P 500 was lower 10 years later.
What the CAPE is terrible at is timing. It crossed 30 in 2017, and anyone who sold then missed one of the best stretches in market history. High valuations tell you the odds of poor long-term returns are rising. They don’t tell you when the music stops.
There are also fair arguments that today’s CAPE overstates the danger:
- Today’s market is built differently. Big tech companies with high profit margins and little debt make up a far larger share of the index than in the past, and they deserve higher multiples than steel mills and railroads did.
- Accounting changed. Rules introduced after 2000 force companies to write down losses faster, which drags down the 10-year earnings average and pushes the CAPE up.
- Buybacks. Companies now return more cash by buying back shares instead of paying dividends, which raises earnings growth per share over time.
Those are real points. They might mean a “normal” CAPE today is 25 instead of 17. They don’t make 40 cheap.
The great secular bull markets, and what ended each one
1921 to 1929: The Roaring Twenties (about 8 years)
What drove it: Electricity reached homes and factories, cars and radios went mainstream, and a new idea, buying things on credit, spread fast. Productivity boomed. The Dow rose roughly sixfold, from about 64 in 1921 to about 381 in September 1929.
How it looked at the end: The CAPE was around 32, a record at the time. Ordinary people were buying stocks with borrowed money: “margin” accounts let investors put down as little as 10% of the price. New investment trusts, a kind of early mutual fund often stuffed with debt, were launched almost weekly. Radio Corporation of America was that era’s hot tech stock.
What ended it: The Federal Reserve raised rates in 1928 and 1929 to cool speculation. Prices cracked in October 1929, and margin calls forced investors to sell, which pushed prices lower, which forced more selling. Bank failures and policy mistakes turned a crash into the Great Depression. The Dow fell about 89% by 1932 and didn’t get back to its 1929 high, in nominal terms, until 1954.
1949 to 1966: The postwar boom (about 17 years)
What drove it: It started from cheap prices: the CAPE was around 10, because investors still remembered the 1930s and expected another depression after the war. Instead came the baby boom, the growth of suburbs and highways, the GI Bill, and two decades in which America was the world’s dominant economy. Inflation and interest rates stayed low. The Dow rose about sixfold, from roughly 160 to nearly 1,000.
How it looked at the end: Investors had come to trust stocks completely. The CAPE climbed to about 24. Growth stocks were the fashion, and by the late 1960s and early 1970s a small group of “one-decision” growth stocks, the Nifty Fifty, traded at 40, 50 or more times earnings because they were seen as too good to ever sell.
What ended it: Inflation. Spending on the Vietnam War and new social programs, with the Fed slow to respond, pushed inflation up from around 2% in the mid-1960s to over 13% by 1979. Interest rates followed. The Dow first touched 1,000 in 1966 and was still below that level in 1982, 16 years later, while inflation more than doubled the cost of living. Measured in real terms, investors lost about two-thirds of their purchasing power. It wasn’t one crash. It was a long grind, including a 48% drop in 1973 and 1974 that wiped out the Nifty Fifty’s premium.
1982 to 2000: The great disinflation bull (about 18 years)
What drove it: Again, it started from very cheap prices: a CAPE around 7, with investors exhausted after 16 years of going nowhere. Then Fed Chair Paul Volcker broke inflation, and interest rates began a long fall: the 10-year Treasury yield went from over 15% in 1981 to about 6% by the late 1990s. Falling rates make stocks more valuable. Add the personal computer, then the internet, globalization, the end of the Cold War, and baby boomers pouring money into new 401(k) plans. The S&P 500 rose about fifteenfold, from around 100 to over 1,500.
How it looked at the end: The CAPE hit its all-time high of about 44 in December 1999. Companies with no profits, sometimes no revenue, went public and doubled on the first day. Day trading became a hobby. “This time is different” became a slogan: the internet would change everything, so old valuation rules no longer applied. (The internet did change everything. The stocks still crashed.)
What ended it: The Fed raised rates from 4.75% to 6.5% in 1999 and 2000. Many dot-com companies ran out of cash. Then came accounting scandals (Enron, WorldCom) and a recession. The S&P 500 fell about 49% by October 2002, and the Nasdaq fell about 78%. After a recovery, the 2008 financial crisis brought a second drop of about 57%. The S&P 500 didn’t stay above its 2000 high until 2013.
2009 (or 2013) to today: The low-rate, tech and AI bull (13 to 17 years and counting)
When it started is up for debate. The market bottomed in March 2009 at 676 on the S&P 500. But many market historians date the secular bull from 2013, when the S&P 500 finally broke above its 2000 and 2007 peaks for good, ending the secular bear market that began in 2000.
What drove it: Like the two before it, it started from cheap prices (a CAPE around 13 in 2009) and gloomy investors. Then came a decade of near-zero interest rates and Fed bond buying, the smartphone and cloud computing, giant and highly profitable tech platforms, record share buybacks, and since 2023, the artificial intelligence boom. Along the way it survived two sharp drops: the 2020 COVID crash (about 34% in a month) and the 2022 bear market (about 25%), both of which recovered.
Where it stands: The S&P 500 closed at a record of about 7,819 on October 6, 2026, roughly 11 times its 2009 low. As of November 19, it has fallen six days in a row to about 7,176, around 8% below that record.
Are we in a bear market? Not yet. But the trend just cracked.
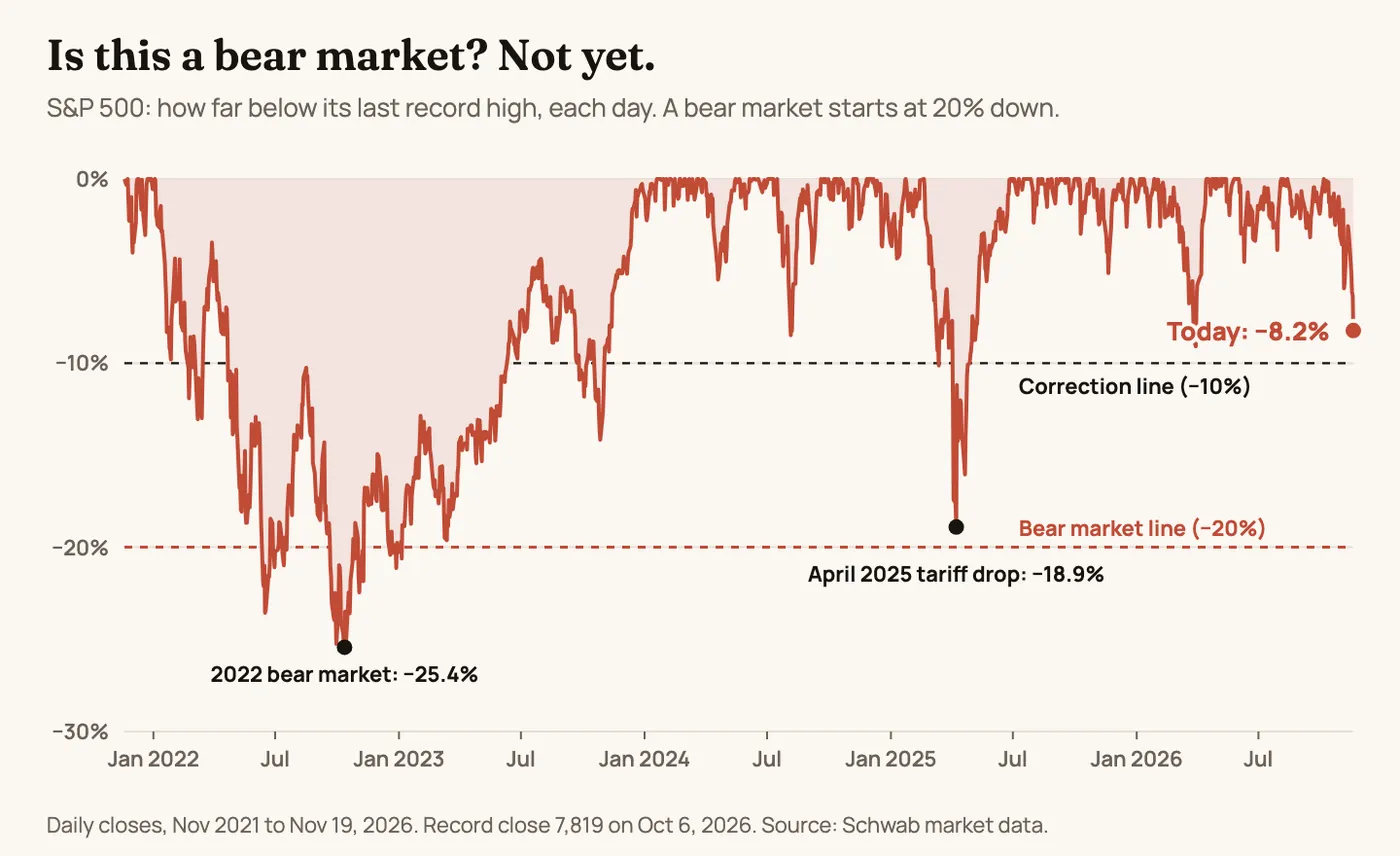
Wall Street uses simple yardsticks for drops from a record high: 10% down is a correction, 20% down is a bear market. As of the November 19 close, the S&P 500 is about 8.2% below its October 6 record. So this isn’t a bear market, and it isn’t even a correction yet. For perspective, the 2022 bear market went 25% deep, and the April 2025 tariff scare stopped just short of 20%.
What changed this week is the trend. Since the April 2025 low, the S&P 500 has climbed in a steady staircase: a line drawn through the April 2025 low (about 4,983) and the March 2026 low (about 6,344) held for 19 months, and the index never closed below it. On November 19 it closed at 7,176, below that line (about 7,238 that day). It also closed below its 200-day moving average, the average of its last 200 closes and one of the most-watched long-term trend markers, for a third straight day, the first time since early April.
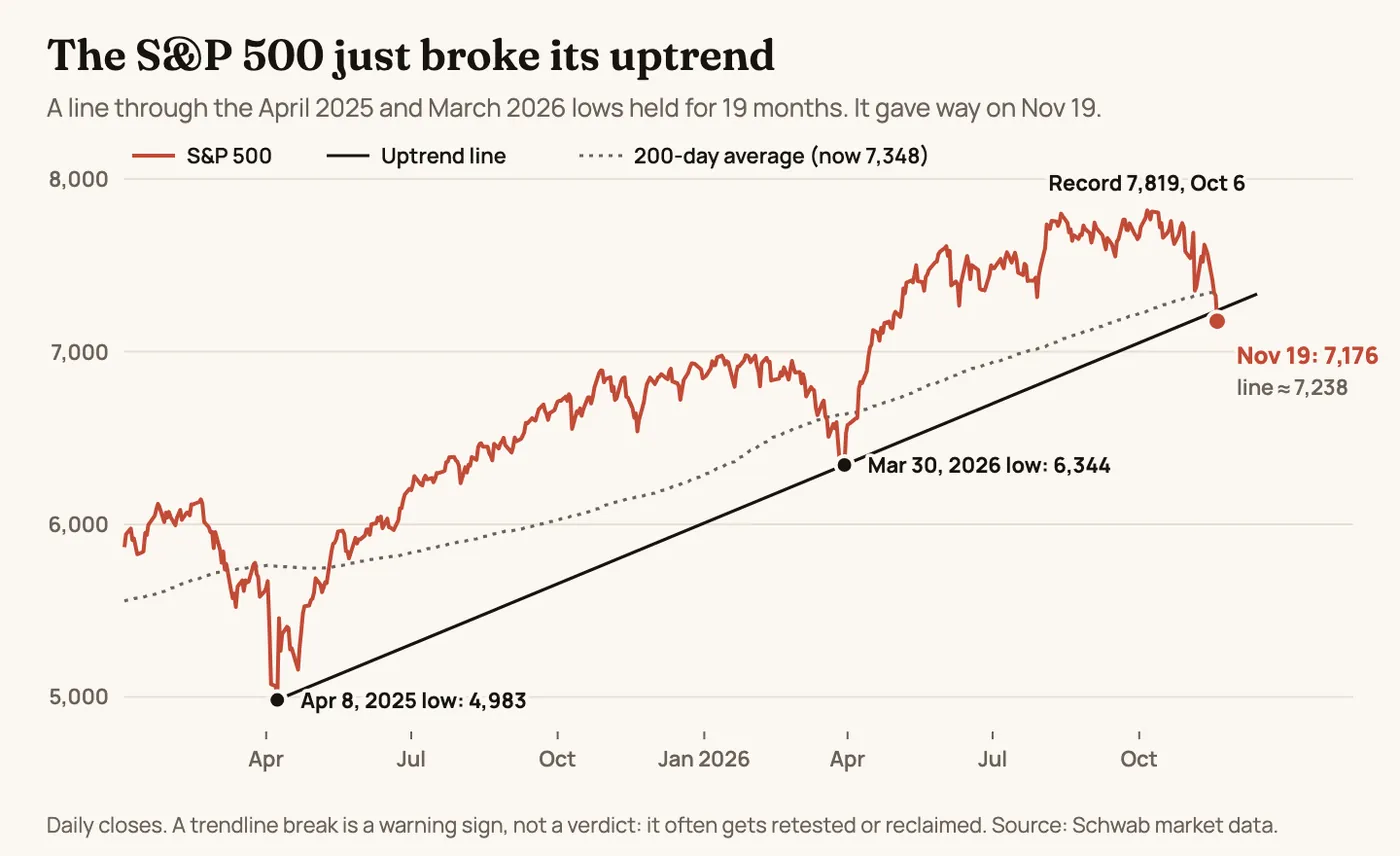
How much does that matter? A broken trendline is a warning, not a verdict. Markets often dip below a line like this, then snap back above it within weeks, and the March 2026 drop looked scary too before the index ran to new records. But it does tell you the easy, steady climb of the last year and a half has been interrupted, and it fits the bigger picture in this article: expensive stocks meeting rising rates. If the S&P 500 can’t get back above about 7,250 to 7,350 (the old trendline and the 200-day average), traders will start watching the 10% correction level, around 7,037, and then the March low.
Is this a flush of retail investors?
When markets drop hard, traders like to ask whether the “weak hands” have finally given up. The idea: when nervous, often borrowed-against, retail money sells all at once, the selling runs out, and that’s often near a bottom. Professionals call it a flush, or capitulation. So has it happened?
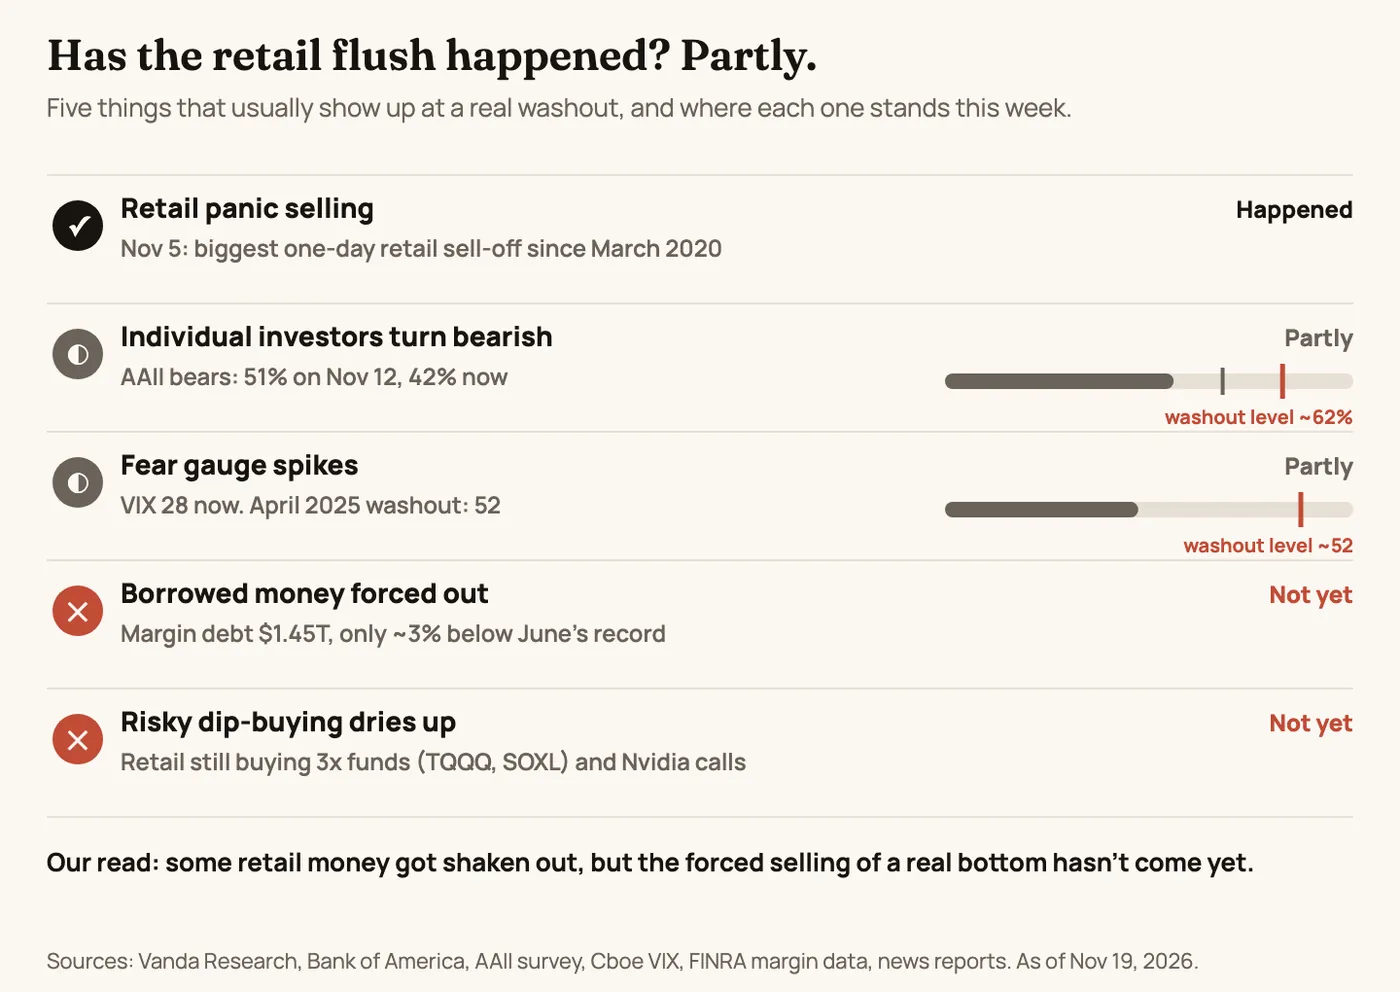
Part of it has.
- On November 5, individual investors sold more single stocks in one day than on any day since the COVID crash of March 2020, according to Vanda Research, which tracks retail trading. Vanda called it a capitulation by retail investors.
- Bank of America’s clients were net sellers for four weeks in a row into mid-November, while big institutions were buying the dip.
- In the AAII survey of individual investors, the share who expect stocks to fall jumped above 51% on November 12. That’s well above the long-run average of about 31%, and pessimism has run above average for 41 weeks straight.
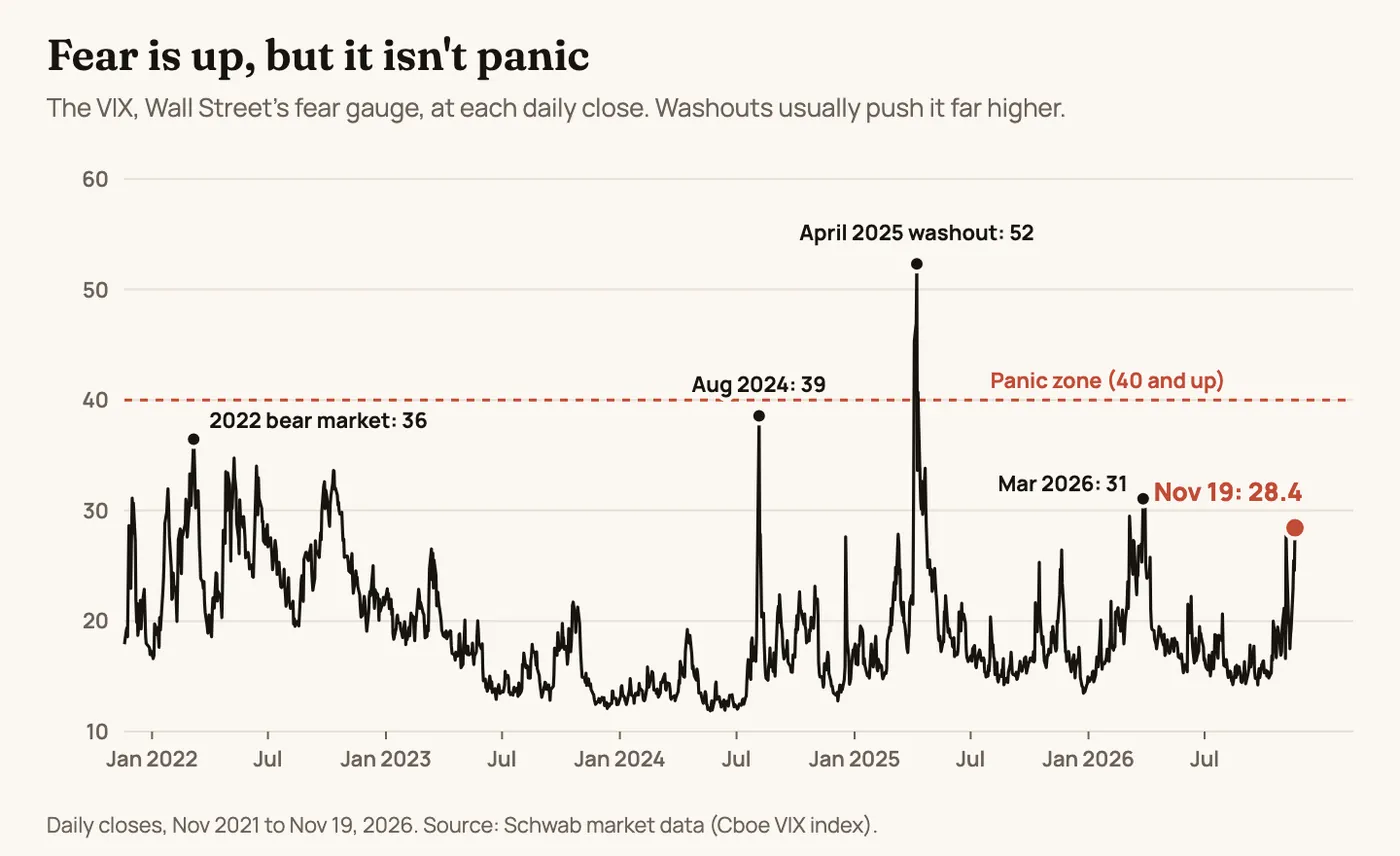
- Wall Street’s fear gauge, the VIX, closed at about 28.4 on November 19, its highest close in two weeks.
But it doesn’t look finished.
- Retail didn’t leave; it got more aggressive. Much of the buying that remained went into leveraged funds like TQQQ and SOXL, which move two or three times as much as the market, and into Nvidia call options. That’s dip-buying with extra risk, not giving up.
- Borrowed money is still near records. Margin debt, the money investors borrow from brokers to buy stocks, was about $1.45 trillion at the end of October, according to FINRA. That’s only about 3% below June’s record of $1.50 trillion, and up more than 20% from a year earlier. A real flush usually forces that number down hard, through margin calls, and the data doesn’t show that yet.
- Fear is high, not extreme. At past washouts, the readings went much further. In April 2025 the VIX closed above 50, and 61.9% of AAII members were bearish, one of the three highest readings in the survey’s history. (The record, 70.3%, came in March 2009, at the bottom of the financial crisis.) This week, bearish readings actually eased to about 42%.
- Leveraged funds can make the selling feed on itself. Funds that promise two or three times the market’s daily move have to sell more stocks on down days to stay on target, which adds pressure late in the trading day, the same pattern as this week’s afternoon fades.
Our read: the early-November selloff shook out some retail money, but the full-on flush, where borrowed money gets forced out and fear hits extremes, hasn’t clearly happened yet. That cuts both ways. It means this drop may not be over. It also means that if a real washout comes, it could set up the kind of buying opportunity that the April 2025 low turned out to be. Either way, it’s one more reason to keep borrowed money out of your portfolio.
Is the shakeout being done on purpose?
It’s a fair question, and a common feeling: the market seems to drop just far enough to scare people out, then turns around once they’ve sold. We’ve written about how that can work in individual stocks in The 5-Step Cycle of Stock Market Manipulation. So is big money pushing this drop to shake out the “weak hands” and buy back in cheaper?
Start with who was on the other side. In the week of the November 5 sell-off, Bank of America’s retail clients sold about $2 billion of stocks, their fourth straight week of selling. Its institutional clients bought more than $6.1 billion. The pros were buying what the public was selling.
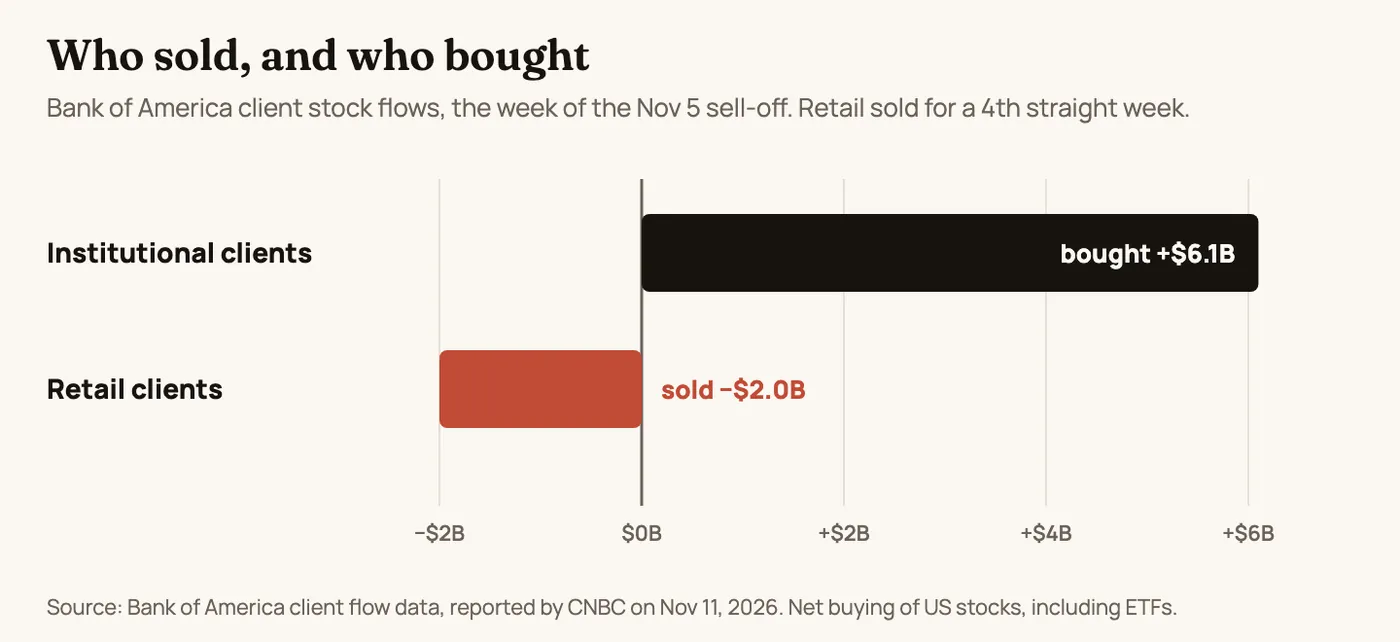
That doesn’t take a secret meeting. Three ordinary things make a drop look orchestrated:
- Big money can afford to wait. Pension funds, endowments and hedge funds have cash, long time horizons and shopping lists with prices on them. When forced or frightened sellers show up, they buy. They don’t need to cause the panic to profit from it, only to be ready for it.
- Machines make drops faster. Leveraged funds have to sell more stock on down days, usually near the close. Options dealers who sold protection to nervous investors sell stock futures to hedge as prices fall, which pushes prices down further. Trend-following funds sell automatically when prices break well-watched levels, like the 200-day average the S&P 500 just broke. None of that is planned, but it all points the same way at the same time, which is why so many of this month’s drops came late in the day.
- Obvious levels attract stop-losses. Lots of investors set automatic sell orders just under a well-known low. A quick dip below that level sets them all off at once, and bigger traders can buy into that burst of selling. Traders call it a stop hunt. It happens in individual stocks and futures, and it’s one reason prices so often dip just under a level and then snap back.
Some of it does cross the line, and that part is illegal. Placing fake orders to move prices (called spoofing) or spreading false rumors is market manipulation, and regulators do go after it: JPMorgan paid $920 million in 2020 to settle spoofing charges in metals and Treasury futures. But selling first, talking the market down on TV, or simply waiting with cash for others to panic is legal, and it’s how patient money has always made money.
Our take: this sell-off has real causes (rising rates, hot inflation, a Fed still hiking and very expensive stocks), so it isn’t just a game. But the way it’s playing out, with sharp late-day drops, breaks of obvious levels and retail selling while institutions buy, is exactly how impatient money hands patient money a better price. Whether you call that orchestrated or just the way markets work, the defense is the same: don’t invest with borrowed money, don’t park your stop-loss right where everyone else’s is, and keep a list of strong companies with the prices you’d be happy to pay.
Today vs. the end of past secular bulls
Here’s how the classic warning signs from past peaks line up with today.
| Warning sign at past peaks | 1929 | 1966 | 1999 | Today |
| Very high valuations (CAPE) | ~32, a record | ~24 | ~44, the record | ~40, second-highest ever |
|---|---|---|---|---|
| Age of the bull market | 8 years | 17 years | 18 years | 13 to 17 years |
| Rising inflation | No | Yes, starting | Mild | Yes: hot reports in 2026 |
| Fed raising rates | Yes | Yes | Yes | Yes, a December hike looks nearly certain |
| High or rising long-term interest rates | Rising | Rising | ~6% | 10-year above 5%, near a 24-year high |
| Borrowing and debt boom | Margin debt | Moderate | Tech and telecom debt | Record corporate bond sales, much of it for AI |
| IPO frenzy | Investment trusts | Late-1960s “go-go” IPOs | Dot-com IPOs | Largest IPOs in US history: SpaceX ($75B) in June, Anthropic ($81B) this week |
| Narrow leadership, a few stocks carry the market | RCA, autos | Nifty Fifty (just after) | Tech, media, telecom | Top 10 stocks ~35% to 40% of the S&P 500 |
| “This time is different” story | New era of prosperity | Growth stocks never fall | The internet | AI |
By that checklist, today scores high on nearly every line. The most worrying combination is the one that ended both the 1966 and 2000 bull markets: very expensive stocks plus rising inflation and interest rates. That’s exactly what pulled the market down this week: the S&P 500 lost about 5% while the Fed signaled more hikes and the 10-year yield held above 5%.
The case that the bull market still has room
To be fair, there are real differences from 1999 and 1929:
- The profits are real. In 1999, many of the hottest stocks had no earnings at all. Today’s leaders make enormous profits. Nvidia’s revenue more than doubled in its latest quarter, and after the recent drop it trades around 16 times its past year of earnings. Alphabet trades near 15. Those are not bubble multiples for companies growing that fast.
- Earnings are still growing fast. Analysts expected S&P 500 earnings to grow close to 30% in the third quarter of 2026. Rising earnings can bring a high CAPE down over time without a crash, if prices go sideways while profits catch up.
- AI may be a genuine productivity wave, like electricity in the 1920s or the internet in the 1990s. Those were real revolutions too. The lesson from history is that a real revolution and a stock market bubble can happen at the same time.
- Secular bulls have lasted longer than people expected. Many investors called the top at a CAPE of 30 in 2017. They were early by years.
So which is it?
Nobody can know for sure, and anyone who tells you the date of the next crash is guessing. But the patterns from a century of market history point in a clear direction:
- Secular bull markets start cheap and end expensive. Today is expensive by almost any long-term measure, about as expensive as any time except the peak of the dot-com bubble.
- They usually last 15 to 18 years. Depending on whether you count from 2009 or 2013, this one is 13 to 17 years old. That’s late, not early.
- They end when inflation and interest rates turn against them. That’s the part to watch most closely now. A Fed that has to keep raising rates, with a 10-year yield above 5%, is the same backdrop that ended the 1966 and 2000 bull markets.
- The signs of speculation are here: record IPOs, record corporate borrowing, and a market leaning on a small number of giant stocks.
Our read: this looks more like the late stage of a secular bull market than the early or middle stage. Whether it ends with a 1999-style crash, a 1966-style long sideways grind, or a few years of flat prices while earnings catch up depends mostly on what happens to inflation and interest rates from here. Late-stage bull markets can still rise a lot before they end. Back in 1997, the S&P 500 roughly doubled again before the 2000 peak.
What this means for you
Nothing here is a reason to sell everything. It’s a reason to make sure your plan would survive a bad decade, not just a bad month.
- Expect lower returns from here. History says that buying the US market at a CAPE near 40 has usually led to below-average returns over the next 10 years. Plan your savings rate around a more modest number, not the last decade’s.
- Look at what you actually own. If a handful of giant tech stocks make up a big share of your portfolio, through index funds plus individual picks, you’re more concentrated than you might think. Spreading out across equal-weight funds, smaller companies, value stocks, international markets and bonds is a way to stop depending on one theme.
- Rebalance. If stocks have grown well past your target mix, trimming back to it locks in some gains without having to guess the top.
- Keep your emergency fund and your near-term money out of stocks. Money you need within about five years shouldn’t depend on the market’s mood.
- Avoid borrowing to invest. Margin is what turned 1929’s drop into a collapse. It does the same to individual portfolios.
- Keep investing on a schedule. In every secular bear market, steady monthly buying through the gloom set up the next great run. The investors who did best after 2000 and 2008 were the ones who kept buying.
- Know the difference between a great company and a great price. This week’s screen of oversold S&P 500 stocks turned up some excellent businesses at low P/E ratios. A low price on a strong company with manageable debt is very different from a high price on a story.
We track the stocks we’re watching on On Our Radar, free, and we make plenty of trades of our own: Pro members can see every one, updated hourly.
The bottom line
The Shiller CAPE is close to its dot-com record, the bull market is roughly as old as the longest in history, and the Fed is raising rates into a debt boom. Those are the same conditions that marked the end of past secular bull markets. History can’t tell us the timing, and today’s companies are far more profitable than 1999’s. But the odds now favor more modest returns over the next decade than the last one, and a plan built for that is a plan that lets you stay invested, whatever comes next.
This article is for education only, not financial advice. Do your own research and talk to a professional about your own situation. The authors may own stocks mentioned.
We don't currently earn commissions from links on this site. Nothing here is personalized investment advice; we are not licensed financial advisors. The authors may hold positions in securities we mention and may trade them at any time.