Stock MarketInterest RatesOilInflation
Rate Hikes, 5% Bond Yields and $100 Oil: What History Says Comes Next

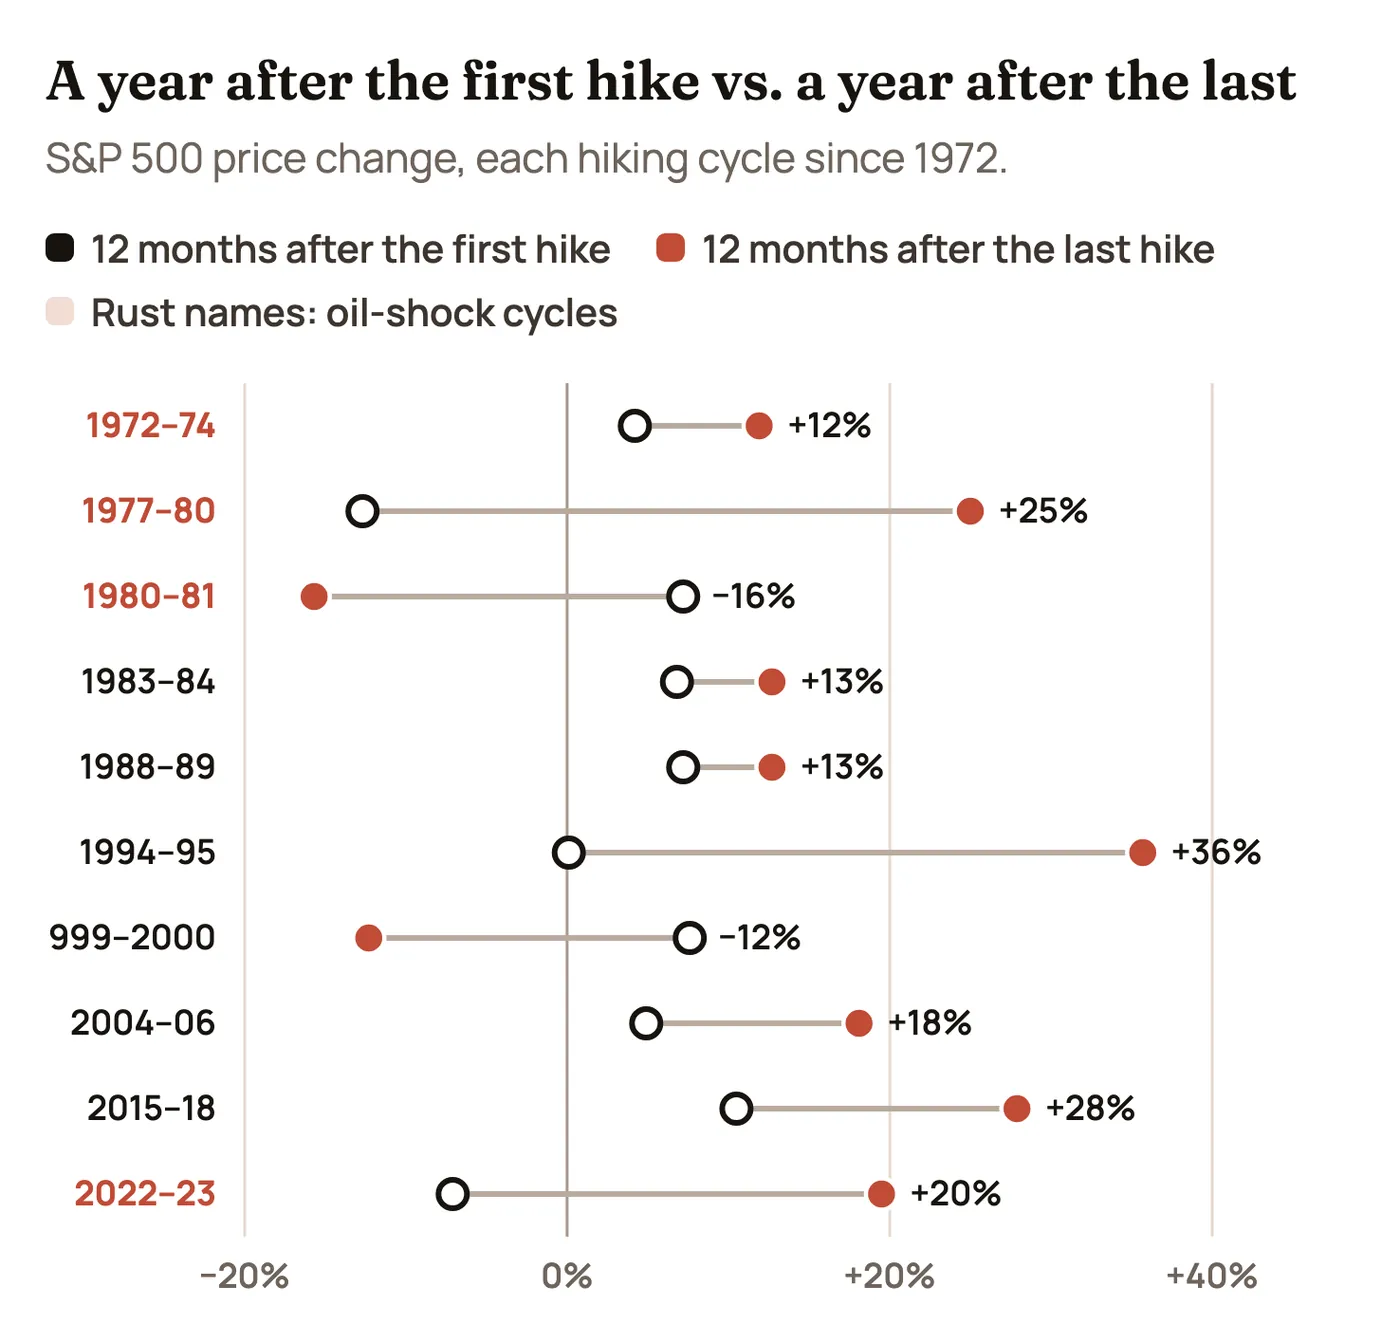
The short version: The Fed is raising rates again, the 10-year Treasury yield has been above 5% and oil spent October near $100 a barrel. That mix has shown up before, and it has a reputation for wrecking stock markets. The record is more mixed than the reputation. Across the 10 Fed hiking cycles since 1972, the S&P 500 was lower three months after the first hike in 7 of them, but higher a year later in 8, and higher a year after the last hike in 8. The cycles that really hurt had one thing in common: an oil shock that pushed inflation up while the Fed was already raising rates. 2026 looks like one of those, which is why the details below matter.
This is the same kind of history check we did for what a Democratic Congress means for stocks: lay out the facts we have today, line them up against every comparable period we can measure, and look for where history rhymes and where it doesn’t. It isn’t a forecast and it isn’t advice. It’s a map of how markets have behaved when rates, yields and oil all rise together, so the next few months are easier to read.
Where Things Stand on November 10, 2026
Here’s what we actually know, as of this morning’s inflation report.
| The variable | Where it is | Why it matters |
| Fed funds rate | 3.75% to 4.00% after a quarter-point hike on September 16, the first hike since 2023. Held at the October 28 meeting, 10 to 2, with two officials voting for another hike. | Sets the cost of short-term borrowing for banks, companies and anyone with a credit card or variable-rate loan. |
| Inflation (October CPI, out today) | Prices rose 0.4% in October, a bit hotter than the 0.3% expected. Core prices (without food and energy) rose 0.3%, also above forecast, and the third 0.3% month in a row. Energy rose 0.7%, food 0.5%, and housing costs were about a third of the increase. | Three months of 0.3% core inflation works out to roughly 3.6% a year, well above the Fed’s 2% goal. Last year’s government shutdown left a gap in the data, so there’s no official year-over-year number this month. September’s was 3.7%. |
| 10-year Treasury yield | About 5.0% today, after topping 5.3% in early October, the highest since 2002. The 30-year hit about 5.6% in late September, a 24-year high. | The 10-year sets mortgage rates and is the yardstick investors use to value every stock. When a “risk-free” bond pays 5%, stocks have to work harder to look attractive. |
| Oil | West Texas crude averaged about $102 a barrel in October and Brent touched about $118 on October 30. Both have since dropped sharply on hopes of de-escalation and a G7 plan to release 100 million barrels from reserves: Brent is about $92 and West Texas about $86 today. | Oil feeds into almost everything: gasoline, shipping, airfares, plastics, food. It is the main reason this year’s inflation picture changed. |
| The economy | Third-quarter growth was strong at 3.4% a year. Employers added 165,000 jobs in October and unemployment is 4.1%. | A strong economy gives the Fed room to keep raising rates without worrying much about a recession, at least for now. |
| Stocks | The S&P 500 is near 7,500, a little below its record from October 6. The Nasdaq fell into a correction (down 10% from its high) on November 5, then bounced hard. Futures slipped after this morning’s CPI report. | Stocks are still close to their highs, which means a lot of good news is already priced in. |
The why behind the oil spike matters as much as the price. This isn’t the 2004 to 2006 kind of oil rally, where prices rose because the world economy was booming. Oil jumped this year because of the war with Iran and attacks on shipping around the Strait of Hormuz, the narrow channel that roughly a fifth of the world’s oil passes through. Economists call that a supply shock: prices go up because supply is threatened, not because demand is strong. Supply shocks are the kind that push inflation up and growth down at the same time, and that is exactly the bind the Fed fears most.
December and January: how likely are more (or bigger) hikes?
Going into today, futures markets put the odds of another quarter-point hike at the December 8–9 meeting near certain, around 99% on the CME FedWatch tool. The question has shifted to how big and how many:
- A half-point hike in December was priced at roughly 11% to 15% after the report. Governor Waller said before the release that he’d consider a half point if core inflation came in at 0.3% or higher. It did, which keeps that door open.
- Another hike by March is priced at about two in three, up from about even odds before the report. That puts the January 26–27 meeting firmly in play.
- Two more hikes is the call from some Fed officials, such as Dallas Fed President Logan, and from some Wall Street economists, including Goldman Sachs.
Our read of the history below: a half-point move would matter less for its size than for what it signals. In 1994, the surprise wasn’t any single hike. It was that the Fed kept going longer and faster than the bond market expected, and bond yields jumped about 2.2 percentage points in nine months. Watch the tone in December as closely as the number.
Why Higher Rates Usually Hit Stocks First
The first reaction to rate hikes is almost always selling, and for good reasons:
- Borrowing costs go up. Companies that roll over debt or borrow to grow pay more interest, which comes straight out of profits. Smaller and more indebted companies feel it first.
- Future profits are worth less today. Investors value a stock by adding up the profits it will earn in the future, then shrinking them back to today’s dollars using interest rates. Higher rates shrink them more. That’s why fast-growing tech companies, whose profits sit far in the future, tend to drop hardest when yields jump.
- Bonds become real competition. When a 10-year Treasury pays 5% with almost no risk, some money leaves stocks for bonds. The S&P 500’s earnings yield (profits divided by price) is now below the 10-year yield, which makes stocks look expensive on that measure.
- Consumers slow down. Higher mortgage, car loan and credit card rates take money out of household budgets, which eventually shows up in sales.
But you’re right to remember periods where stocks rallied with rates high. They happened, often. The pattern is that markets react to the direction and surprise in rates more than the level. Stocks have done well with a 5%, 8% or even 13% fed funds rate, as long as inflation was falling or stable and investors believed the peak was close. The chart below has every month since 1970.
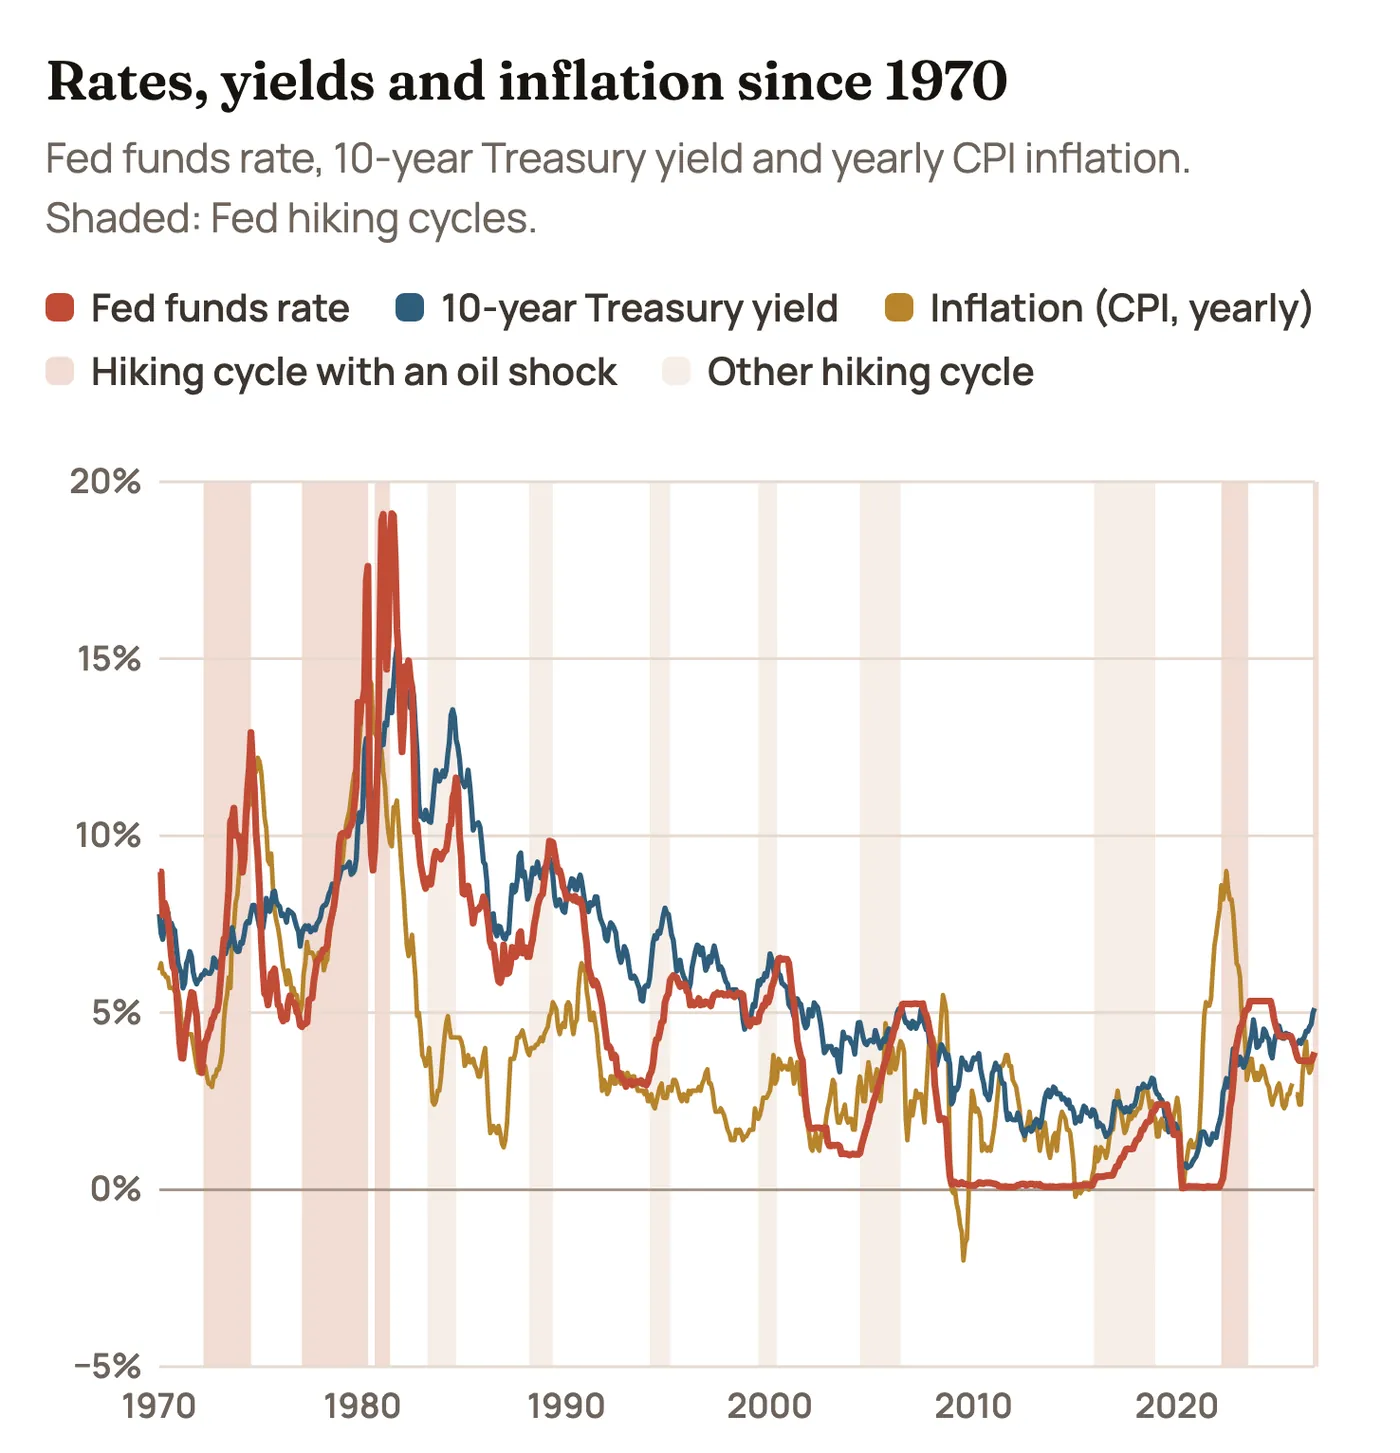
Two things jump out. First, the 1970s and early 1980s were a different world: rates in the double digits and inflation that took a decade and a brutal recession to kill. Second, the last time inflation spiked on an energy shock (2022), the Fed moved later and faster than at any point since Volcker, and the 10-year yield went from under 2% to 5% in about 18 months. Today’s starting point is in between: inflation well above target but nowhere near 1970s levels, and rates already fairly high before this cycle began.
Ten Hiking Cycles, Side by Side
We measured every Fed hiking cycle since 1972, from the day before the first hike. The table includes the cycle’s range for the fed funds rate, how much oil moved, and how the S&P 500 did at each stage. Click a column to sort.
| Hiking cycle | Fed funds, start → peak | Oil change | S&P 3 mo. after first hike | S&P 12 mo. after first hike | Worst drop during cycle | S&P, first hike to last | S&P 12 mo. after last hike |
|---|---|---|---|---|---|---|---|
| 1972–741973 Arab oil embargo | 3.30% → 12.92% | +184% | +2.9% | +4.2% | −25.6% | −25.6% | +11.9% |
| 1977–801979 Iranian Revolution | 4.65% → 17.61% | +184% | −7.7% | −12.7% | −19.1% | −1.1% | +25.0% |
| 1980–81Oil at record highs after 1979 | 9.03% → 19.08% | 0% | +6.1% | +7.2% | −0.8% | +9.0% | −15.7% |
| 1983–84No oil shock | 8.51% → 11.64% | +10% | +9.8% | +6.8% | −0.2% | +12.6% | +12.7% |
| 1988–89No oil shock | 6.58% → 9.85% | +25% | −0.4% | +7.2% | −6.3% | +19.7% | +12.7% |
| 1994–95No oil shock | 3.05% → 5.92% | +31% | −6.0% | +0.1% | −8.7% | −2.1% | +35.7% |
| 1999–2000No oil shock | 4.74% → 6.27% | +68% | −5.1% | +7.6% | −7.7% | +8.5% | −12.3% |
| 2004–06No oil shock | 1.00% → 4.99% | +76% | −1.9% | +4.9% | −6.4% | +12.0% | +18.1% |
| 2015–18No oil shock | 0.12% → 2.27% | +67% | −0.8% | +10.5% | −10.5% | +22.7% | +27.9% |
| 2022–23Russia’s invasion of Ukraine | 0.08% → 5.12% | +25% | −14.0% | −7.1% | −16.1% | +7.1% | +19.5% |
| 2026 (so far)War with Iran, Strait of Hormuz attacks | 3.63% → 3.88% | +22% | n/a | n/a | −3.1% | −1.2% | n/a |
S&P 500 price change, without dividends. Oil is the change in the monthly West Texas crude price from the first hike to its peak during the cycle. Sources: Federal Reserve via FRED, oil via FRED, S&P 500 from S&P Dow Jones Indices. 2026 is through November 9.
What the table says, in plain numbers:
- The first few months are usually rough. The S&P was lower three months after the first hike in 7 of 10 cycles, by about 1.7% on average.
- A year in, stocks are usually higher. Twelve months after the first hike, the S&P was up in 8 of 10 cycles. The average gain was a modest 2.9%, the median 5.9%.
- The year after the last hike is the best part. The S&P was higher 12 months after the final hike in 8 of 10 cycles, with an average gain of 13.6% and a median of 15.4%.
- The two exceptions were bubbles or recessions. After the last hike in 1981, a deep recession followed. After the last hike in 2000, the dot-com bubble burst. Neither was caused by oil alone, but both happened when stocks were expensive or the economy was already cracking.
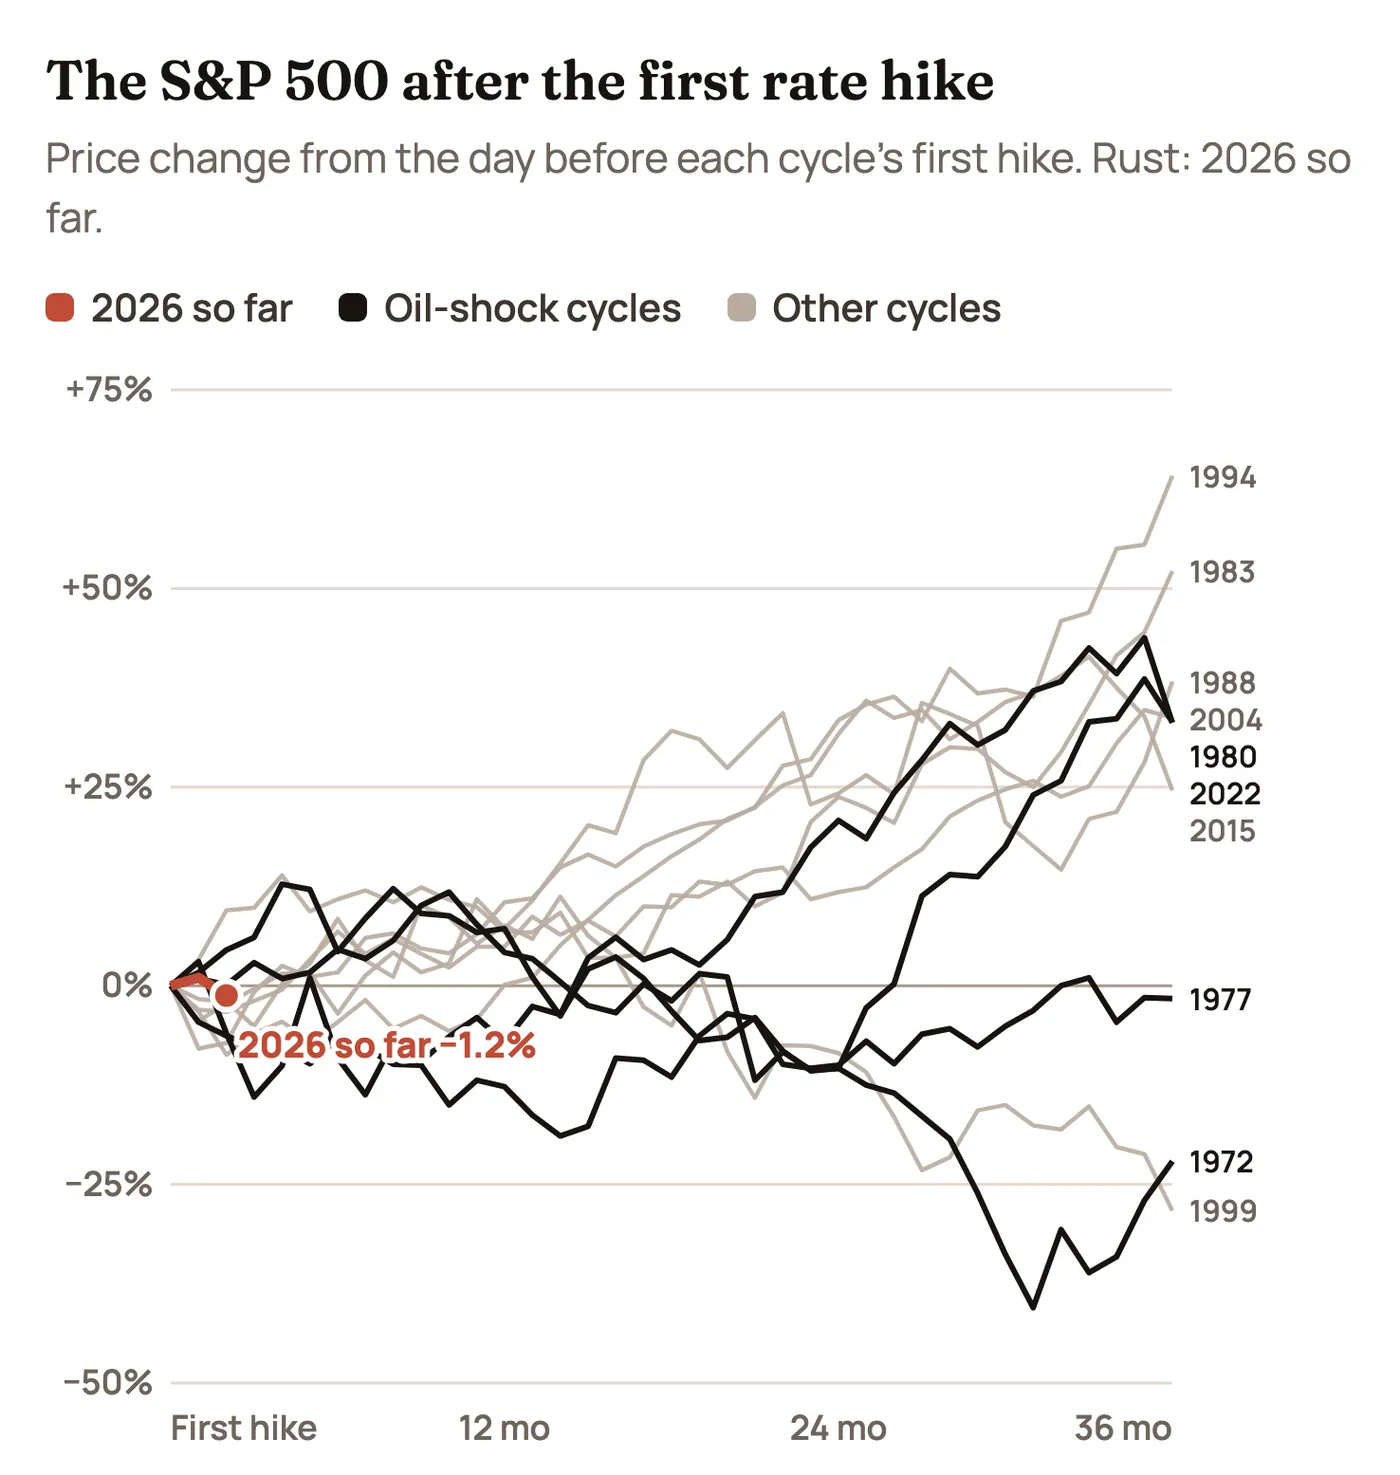
Switch to Oil-shock cycles above the chart and the pattern changes. Of the four cycles that came with an oil shock, two (1972–74 and 1977–80) were still underwater three years later. The other two recovered: 1980–81 and 2022–23 both finished three years up about a third. What separated the groups wasn’t the size of the oil spike. It was whether inflation had already become embedded in wages and expectations. In the 1970s it had. In 2022 it never fully did, and inflation came down faster than most people expected.
Oil: The Variable That Changes Everything
Rising oil during a hiking cycle is actually normal. Oil went up in 9 of the 10 cycles, often a lot. The question is why it went up.
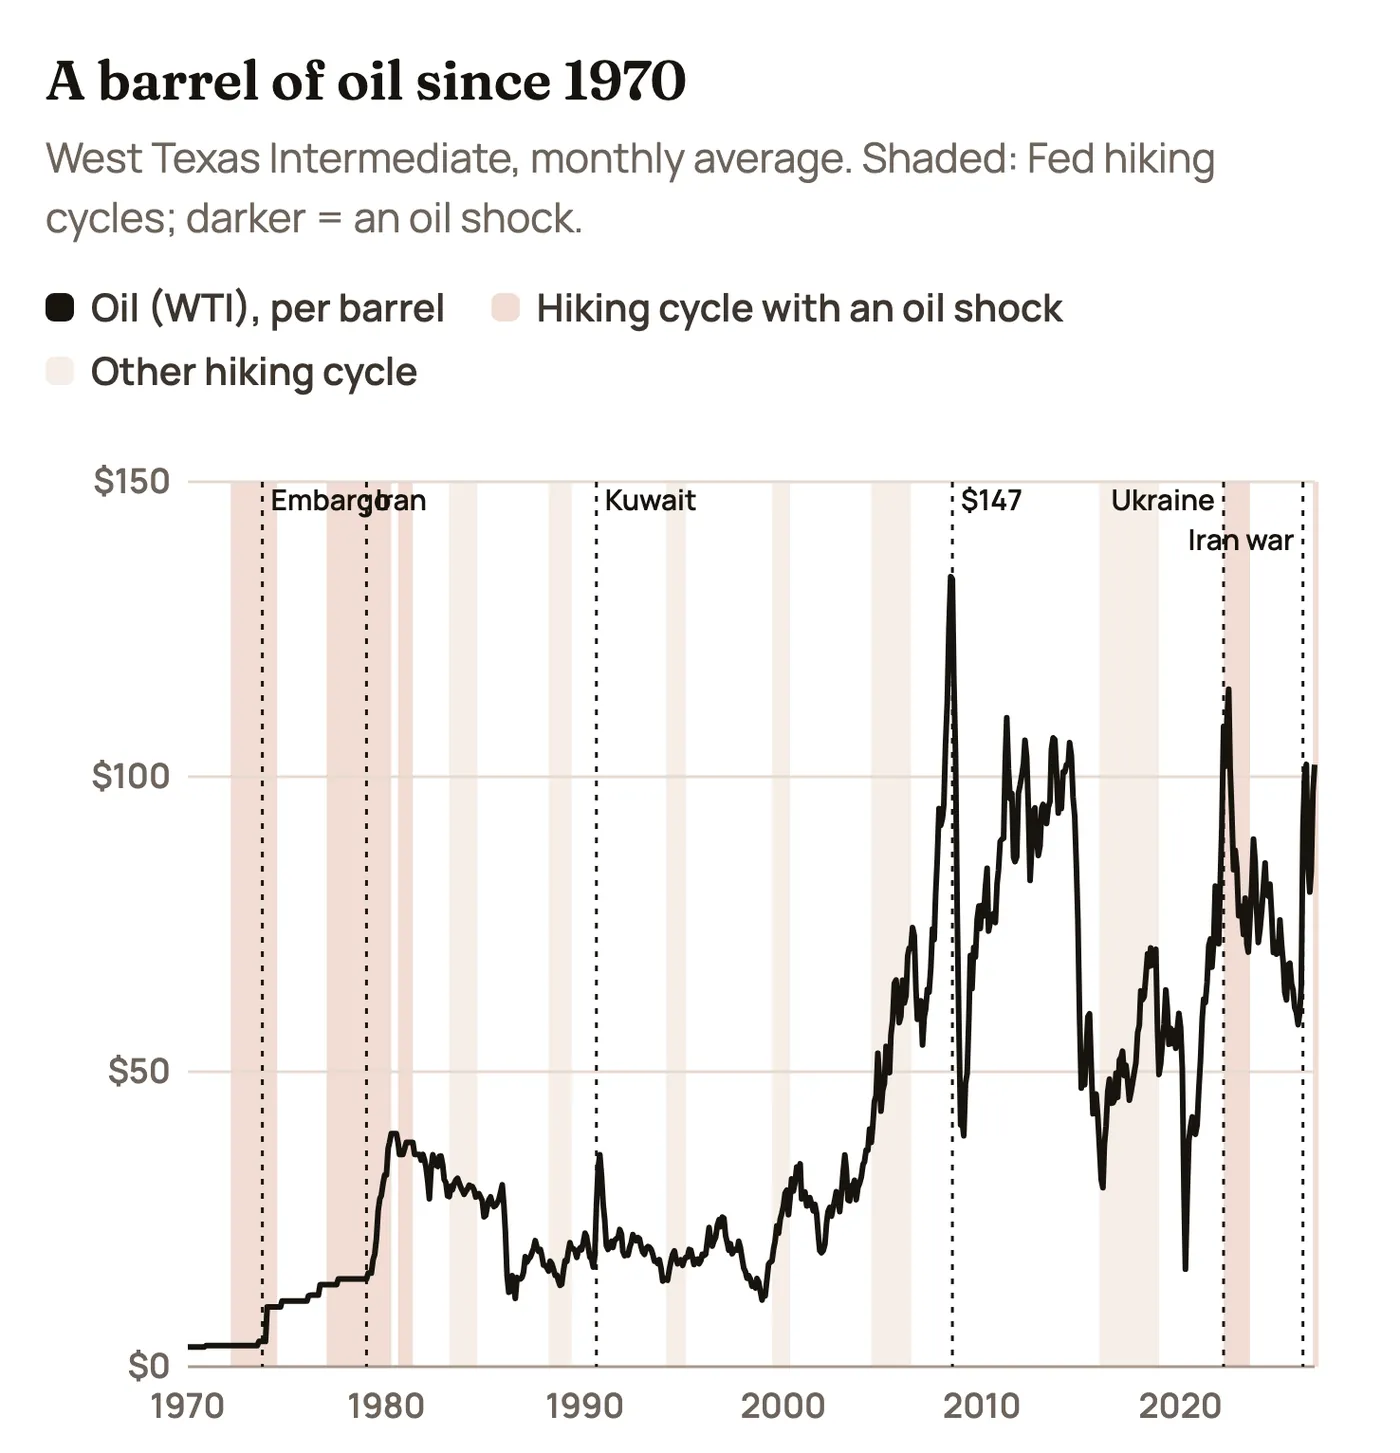
Switch the chart to today’s dollars and October’s $102 average looks less extreme than the headlines. The April 1980 peak was worth about $165 in today’s money, and the June 2008 peak about $208. In real terms, 2026 is a big spike but not a record. What makes it painful is the speed: West Texas crude was about $60 in January. That’s a 70% rise in under a year, about the same pace as 2022.
Here’s how the oil moves split:
| Demand-driven oil rallies | Supply shocks |
| 2004–06: China’s boom pushed oil from $40 to $71 (+76%). The Fed hiked 17 times in a row. Stocks still rose 12%, and energy stocks rose 86%. | 1973–74: the Arab oil embargo nearly tripled the price. The S&P 500 fell almost 50% from peak to bottom, the worst bear market since the Depression. |
| 2017–18: a strong global economy lifted oil from the low $40s to $70. Stocks rose 23% over the full cycle. | 1979–80: the Iranian Revolution doubled oil again. Inflation hit 14.6% and the fed funds rate went above 17%. |
| 1999–2000: oil rose 68% as Asia recovered from its crisis. Stocks were fine until the tech bubble broke. | 2022: Russia’s invasion of Ukraine sent oil to $115. Inflation hit 9%, and the S&P fell 25% before the bottom. |
A demand-driven oil rally is a sign the economy is strong enough to pay for it. A supply shock acts like a tax on every consumer and business at once. The 2026 spike is clearly the second kind. The difference this time is that the economy was growing strongly when the shock hit, much like early 2022, and oil has already given back a lot of its October spike.
The Examples: What Each Cycle Teaches
1972–74: the worst case, and why it’s not the base case
The Fed raised rates from 3.3% to almost 13%. Then came the October 1973 oil embargo, which pushed inflation into double digits. Stocks fell 26% during the cycle and nearly 50% at the bottom in late 1974. The worst of it came from a combination we don’t have today: price controls that broke down, a weak dollar after the end of the gold standard, and a Fed that took years to take inflation seriously. Still, it is the clearest warning of what an oil shock can do when inflation expectations come loose.
1977–81: Volcker, and the rally nobody expected
This is the period most people remember for high rates. The Iranian Revolution doubled oil in 1979. Paul Volcker took over the Fed that August and let rates go wherever they needed to go: the fed funds rate passed 17% in early 1980 and hit 19% in 1981. Yet the S&P 500 rose 26% in 1980, with an average fed funds rate above 13%. Why? A short recession in early 1980 brought rates down sharply for a few months, and investors started betting that Volcker would win. They were early. Rates went back up, a deeper recession came in 1981–82, and stocks fell 10% in 1981.
The bigger lesson is what happened next. The great bull market of the 1980s and 1990s started in August 1982, when the fed funds rate was still about 10% and the 10-year yield about 13%. Stocks didn’t need low rates. They needed rates to stop rising, and they needed to be cheap. In 1982, the S&P traded at about 8 times earnings. Today it’s well above 20.
1983–84 and 1988–89: hikes in a strong economy
Both cycles came with steady growth and only modest inflation. Oil barely mattered (it was falling in the mid-1980s). Stocks rose 13% and 20% during the two cycles. 1989 is a great example of a big rally with high rates: the S&P gained 27% with an average fed funds rate around 9%. In 1985, between those two cycles, stocks gained 26% with rates around 8%.
1987: when bond yields broke the market
Not a hiking cycle in our table, but too important to skip. The 10-year yield rose from about 7% to over 10% in 1987, while stocks kept climbing to a peak in August. The gap between what bonds paid and what stocks earned got too wide, and on October 19, 1987 the Dow fell 22.6% in a day. Rising yields don’t always cause a crash, but they do make a stretched market fragile. That’s worth keeping in mind with stock valuations as high as they are today.
1994: the bond massacre, and the soft landing
Alan Greenspan doubled the fed funds rate from 3% to 6% in a year, starting in February 1994. Bond investors were caught off guard and the 10-year jumped from 5.7% to 8%. It became known as the “bond massacre.” Stocks went nowhere that year, down about 2%. Then inflation stayed calm, the economy avoided recession, and the S&P rose 34% in 1995, with fed funds near 6%. Twelve months after the last hike, stocks were up 36%, the best result in our table. This is the dream scenario for 2026: hikes that are painful in the moment, then a soft landing.
1999–2000: rising oil, a bubble and a Fed that kept going
Oil rose 68% during this cycle, and the Fed pushed rates to 6.5%. Stocks kept climbing as tech soared, up 8.5% over the cycle. Technology stocks rose 32% during the hikes. Then the bubble burst. A year after the last hike, the S&P was down 12%. The lesson: a hiking cycle can look harmless for a long time when one hot sector carries the whole market. That rhymes a little with today’s AI-heavy market.
2004–06: 17 hikes, oil up 76%, and stocks fine
The Fed raised rates a quarter point at 17 meetings in a row, from 1% to 5.25%. Oil went from $40 to over $70. And the S&P rose 12%. Energy stocks rose 86% and utilities 45%. Two things made it work: the hikes were slow and announced well ahead, and the 10-year yield barely moved (Greenspan called that a “conundrum”). The housing bust that followed came later, in 2007–08, and it came from bad lending, not directly from the hikes.
2015–18: slow hikes, then one too many
Starting from zero, the Fed raised rates nine times over three years. Stocks rose 23% during the cycle. But in late 2018, with the 10-year above 3% and the Fed signaling more hikes, the S&P fell almost 20% from September to Christmas Eve. In January 2019, Chair Powell signaled a pause, and the S&P went on to gain 29% that year. The lesson: a single comment about the path ahead can matter more than the hike itself.
2022–23: the closest parallel to today
An energy shock from the war in Ukraine, inflation at 9%, and a Fed raising rates as fast as it ever has: from near zero to over 5% in 16 months. The S&P fell 25% from its January 2022 peak to the October 2022 bottom, and technology stocks fell more. But 2023 was the year that surprised everyone. With the fed funds rate above 5%, the S&P rose 24% in 2023 and another 23% in 2024. When the 10-year yield peaked near 5% in October 2023, stocks rose 37% over the next 12 months. Rates were high, but inflation was falling and the economy kept growing, which was enough.
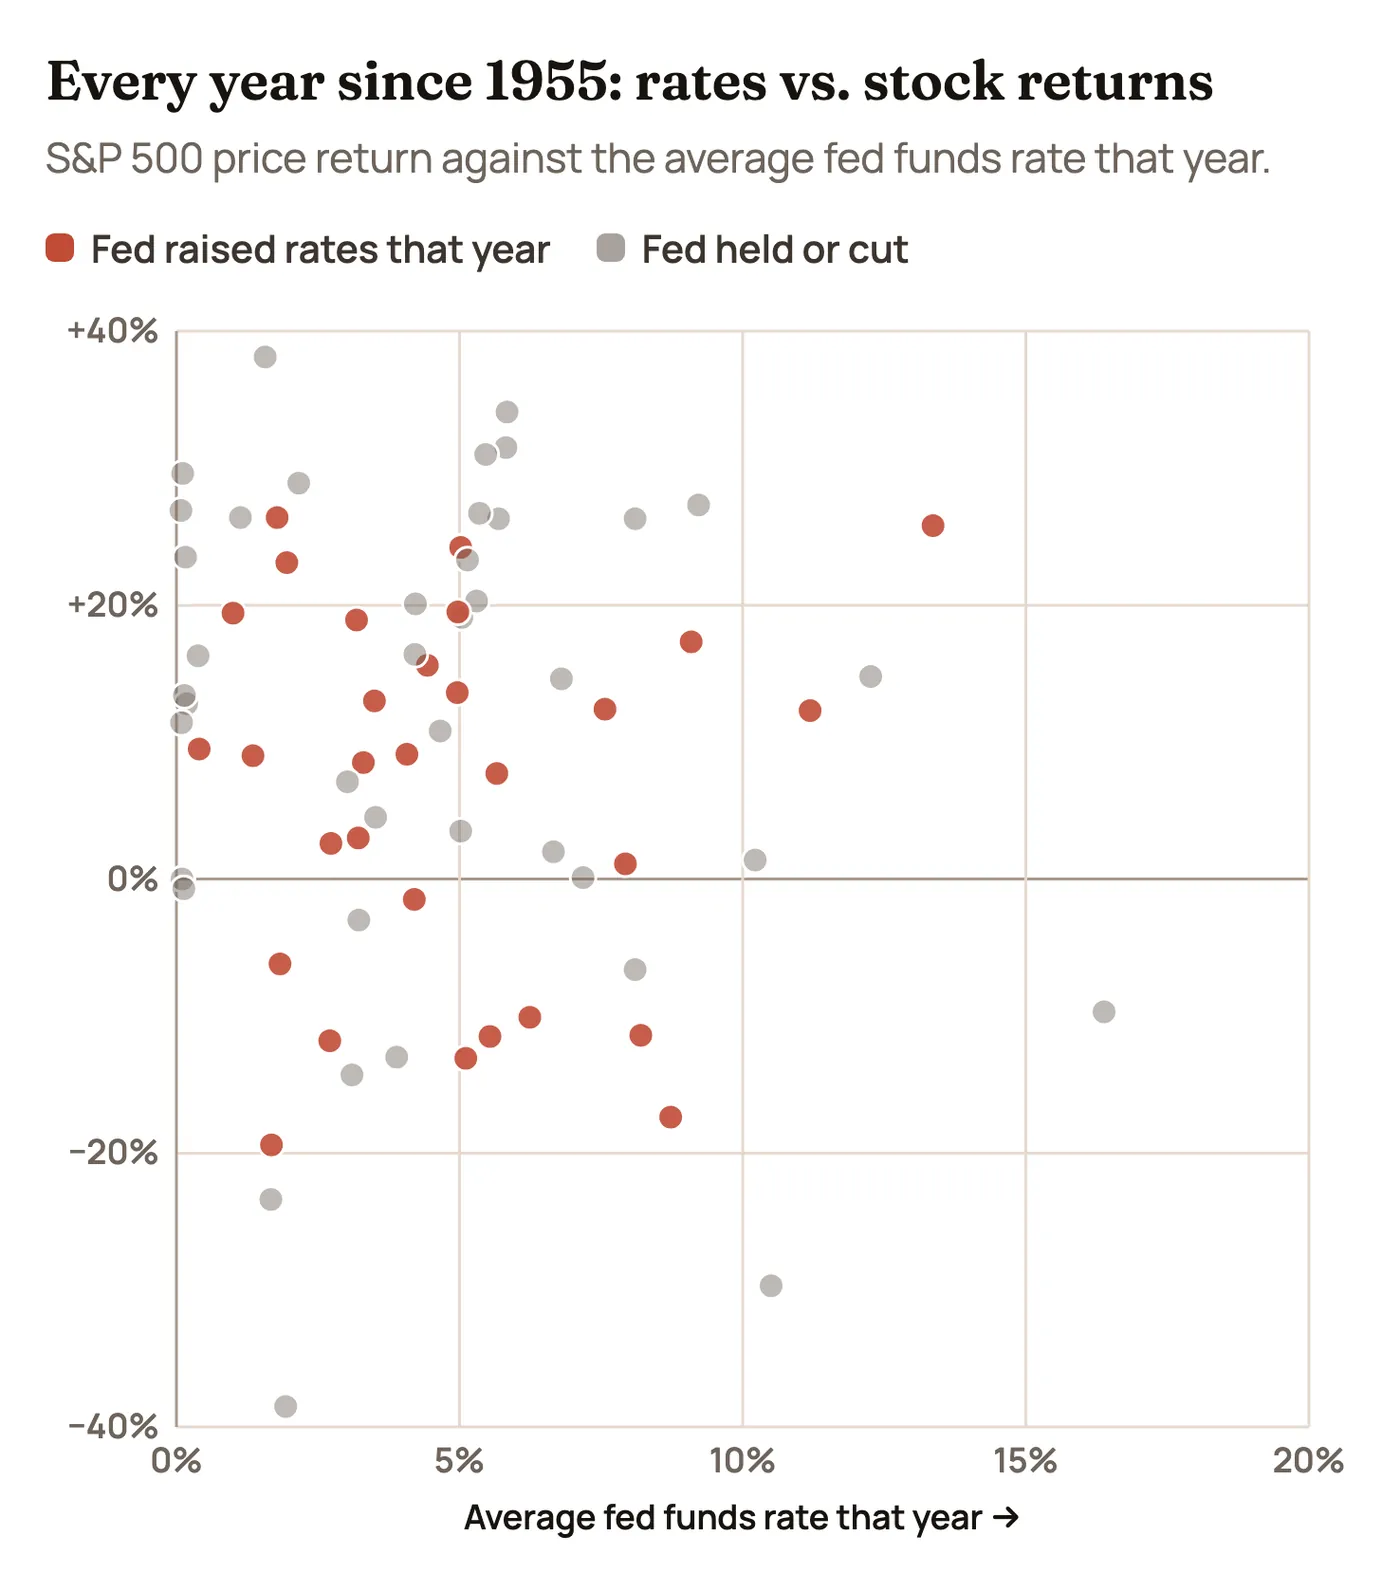
Look at the chart and you’ll see strong years at almost every rate level. Of the 31 years since 1955 when the fed funds rate averaged 5% or more, the S&P rose in 23, with an average gain of 9.5%. Years with rates below 5% averaged 8.6%. The level of rates on its own has told you very little about stock returns. Switch to Rate change and the pattern gets a bit clearer: the very worst years tended to come when rates were rising fast (1973, 2022) or when the Fed was cutting into a crisis (1974, 2002, 2008).
The 10-Year Yield: Why 5% Feels Like a Line in the Sand
The fed funds rate is set by the Fed. The 10-year yield is set by the market, and it’s the one that moves stock prices day to day. It’s been above 5% for most of the last two months, and it’s worth asking what tends to happen once it peaks.
We looked at what the S&P did in the 12 months after the 10-year yield peaked in each period:
| 10-year yield peak | Peak yield | S&P 500, next 12 months |
| April 1975 | 8.4% | +18.4% |
| April 1981 | 14.1% | −12.3% |
| September 1981 | 15.8% | +3.6% |
| May 1984 | 14.0% | +24.9% |
| March 1989 | 9.5% | +17.8% |
| November 1994 | 8.0% | +26.6% |
| January 2000 | 6.8% | −6.8% |
| June 2007 | 5.3% | −10.3% |
| November 2018 | 3.2% | +10.2% |
| October 2023 | 5.0% | +36.8% |
Seven of 10 were up, and the big winners (1984, 1994, 2023) were the times when the yield peaked because inflation was cooling. The three losers (1981, 2000, 2007) were times when the economy was about to fall into recession or a bubble was about to burst. The catch: nobody knows a yield peak is a peak until months later. If the 10-year’s early October high above 5.3% turns out to be this cycle’s top, history leans positive. If it breaks above that level on hotter inflation, the 1994 and 1981 playbooks come into view.
The bond vigilante problem
There’s a wrinkle this time that wasn’t there in 2004 or 2018. The U.S. government is running a deficit of roughly 6% of GDP during a strong economy, so the Treasury has to sell a lot of bonds. When inflation runs hot and supply keeps coming, bond buyers demand higher yields, regardless of what the Fed does. That’s part of why long-term yields jumped faster than short-term rates in September. Investors call this the return of the “bond vigilantes.” It means the 10-year could stay high even if the Fed slows down, which keeps pressure on stock valuations.
Who Leads When Rates and Oil Rise Together
Sector data only goes back to 1999 for most of the big sector funds, which gives us four full cycles plus 2026 so far. Switch between them above the chart.
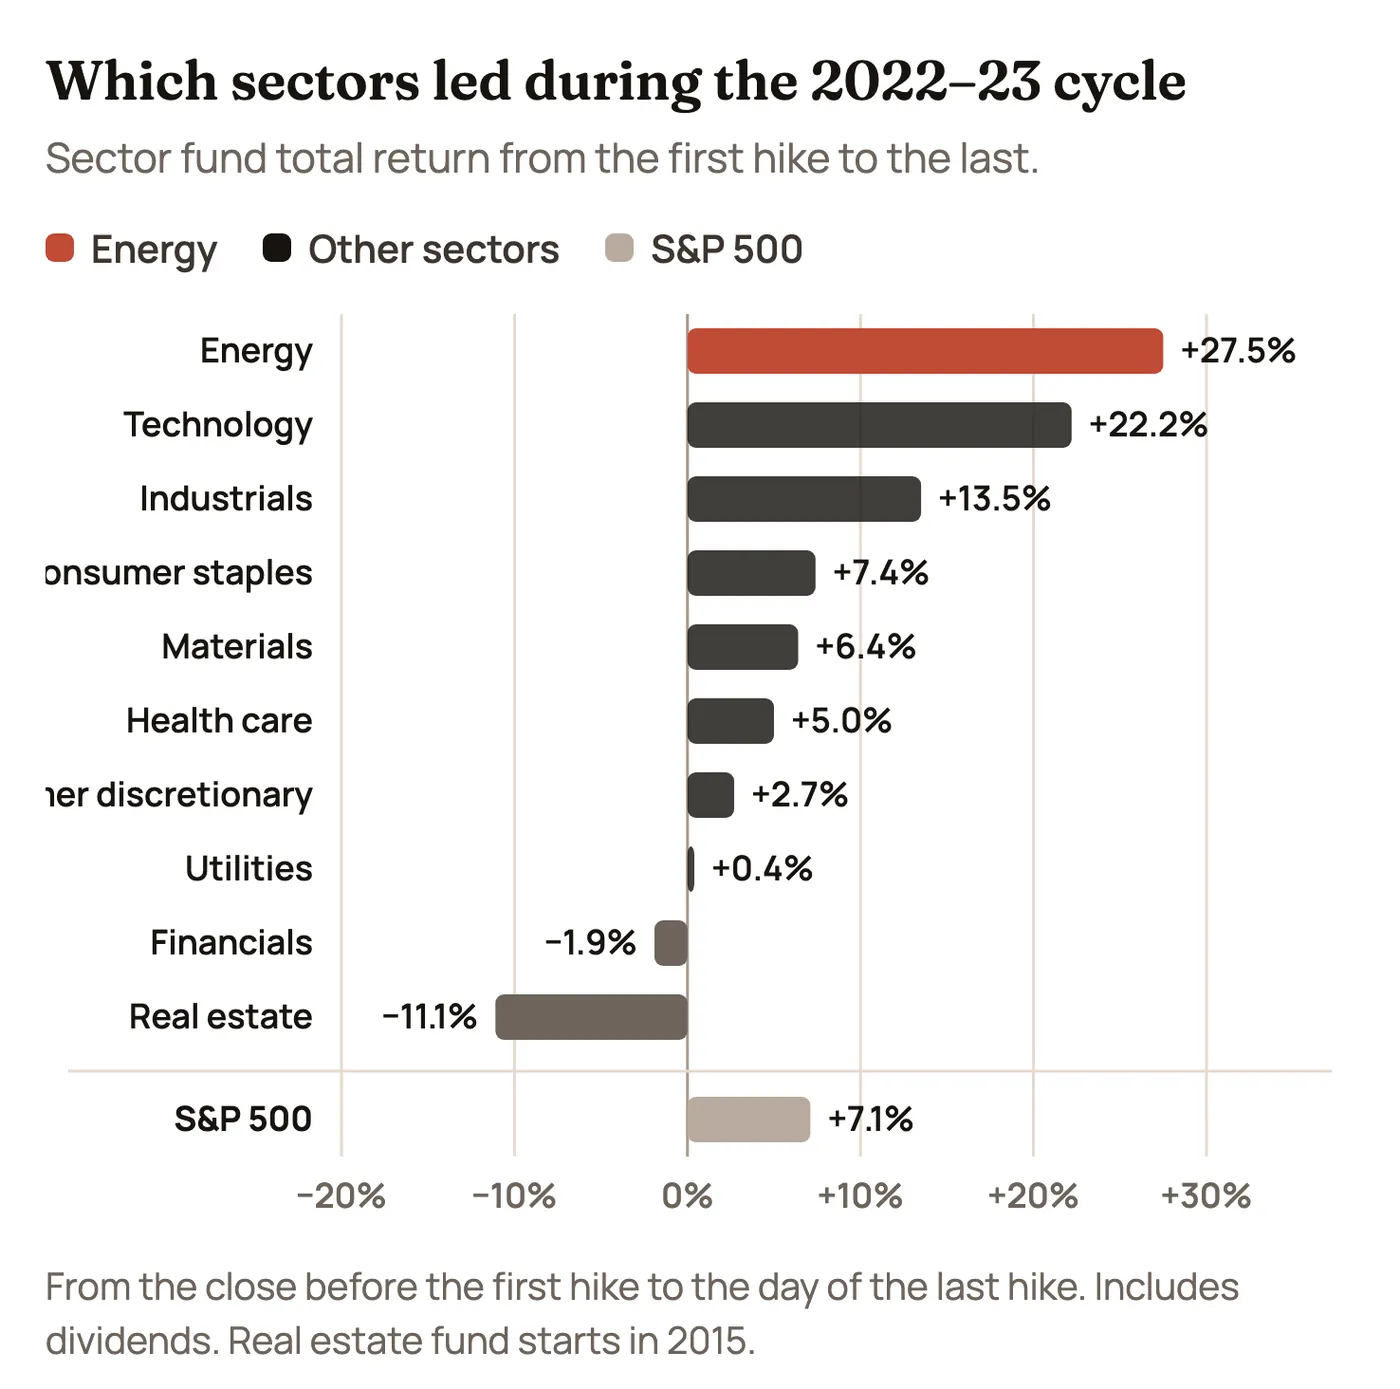
- Energy led whenever oil drove the cycle. Energy stocks rose 86% in 2004–06 and 28% in 2022–23. It’s the most direct hedge when oil is part of the problem.
- Technology led when the economy did. Tech rose 32% in 1999–2000, 51% in 2015–18 and 22% in 2022–23 (after a brutal 2022, then a huge 2023).
- Real estate and banks struggled when rates rose fast. Real estate fell 11% in 2022–23. Banks fell 2%, and that cycle included the 2023 failures of Silicon Valley Bank and others, caused by losses on bonds bought when rates were low.
- Utilities did better than their reputation. They’re supposed to suffer when bonds pay more, but they rose 45% in 2004–06 and 43% in 2015–18. Today, AI data centers’ demand for power gives them a growth story too.
Switch to 2026 so far and you’ll see a market playing defense. Since the September hike, health care (+12.7%), consumer staples (+9.7%) and utilities (+6.6%) have led, while technology (−8.6%) and even energy (−5.3%, after oil came off its highs) have lagged. That is the usual early-cycle pattern: investors move into steady earners first, then wait to see how far rates go.
Where History Rhymes in 2026, and Where It Doesn’t
No past cycle is a perfect match, but four come close in different ways.
| Parallel | What rhymes | What’s different |
| 2022–23 | An oil shock from a war, inflation pushed up by energy, a strong job market, and a Fed that has to choose between growth and prices. | Inflation is about 3.7%, not 9%. The Fed is starting from about 3.6%, not zero, so it doesn’t need nearly as many hikes. And stocks never had a 25% drop beforehand to reset prices. |
| 1994 | A Fed that markets think is behind, a bond selloff, and the risk of faster-than-expected hikes. A half-point move would rhyme strongly. | In 1994 oil was low and inflation was already calm. The 1994 hikes were mostly “insurance.” This time, inflation is actually above target. |
| 1979–80 | An oil shock tied to Iran, rising long-term yields, and a new Fed chair (Kevin Warsh took over this year) with something to prove on inflation. | Inflation then was 13% to 15% and expected to stay high. Today, long-term inflation expectations are still close to normal. That’s the single most important difference. |
| 1999–2000 | A market led by a narrow group of tech stocks at high valuations, rising oil, and a Fed that keeps hiking into strength. | Today’s tech leaders earn huge, real profits. Many 1999 leaders didn’t. But the S&P’s valuation is in the same high range. |
What none of the past cycles had: stock valuations this high at the start of the hikes. The S&P 500 trades at well over 20 times next year’s expected earnings. In 1972, 1977 and 1980, stocks were cheap, which limited how far they could fall once inflation was beaten. In 2026, a lot of good news is already in the price. That’s the biggest reason to take the oil-shock cycles seriously even though the economy is strong.
Three Paths From Here
Here’s how the next six months could play out, with the signs that would tell you which path we’re on.
| Path | What it looks like | Past cycle it rhymes with | Signs to watch |
| Soft landing | One or two more quarter-point hikes, oil settles near $80 to $90, core inflation slows to 0.2% a month by early 2027. The 10-year drifts back toward 4.5%. | 1994–95, 2023 | Oil staying down after the de-escalation, core CPI at 0.2% in December or January, the Fed hinting at a pause. |
| Higher for longer | Core inflation stays at 0.3% a month, the Fed hikes in December and January (maybe a half point), and the 10-year breaks above 5.3%. Stocks churn and the most expensive ones fall. | 2022, late 2018 | A half-point hike or a “more to come” message in December, wage growth picking up, the 30-year back above 5.5%. |
| Oil shock 2.0 | Fighting flares up again around Hormuz, Brent goes back above $110, and inflation and growth move in opposite directions. The Fed has to pick one. | 1973–74, 1979–80 | Shipping attacks resuming, the reserve release failing to cap prices, consumer spending and hiring slowing while prices rise. |
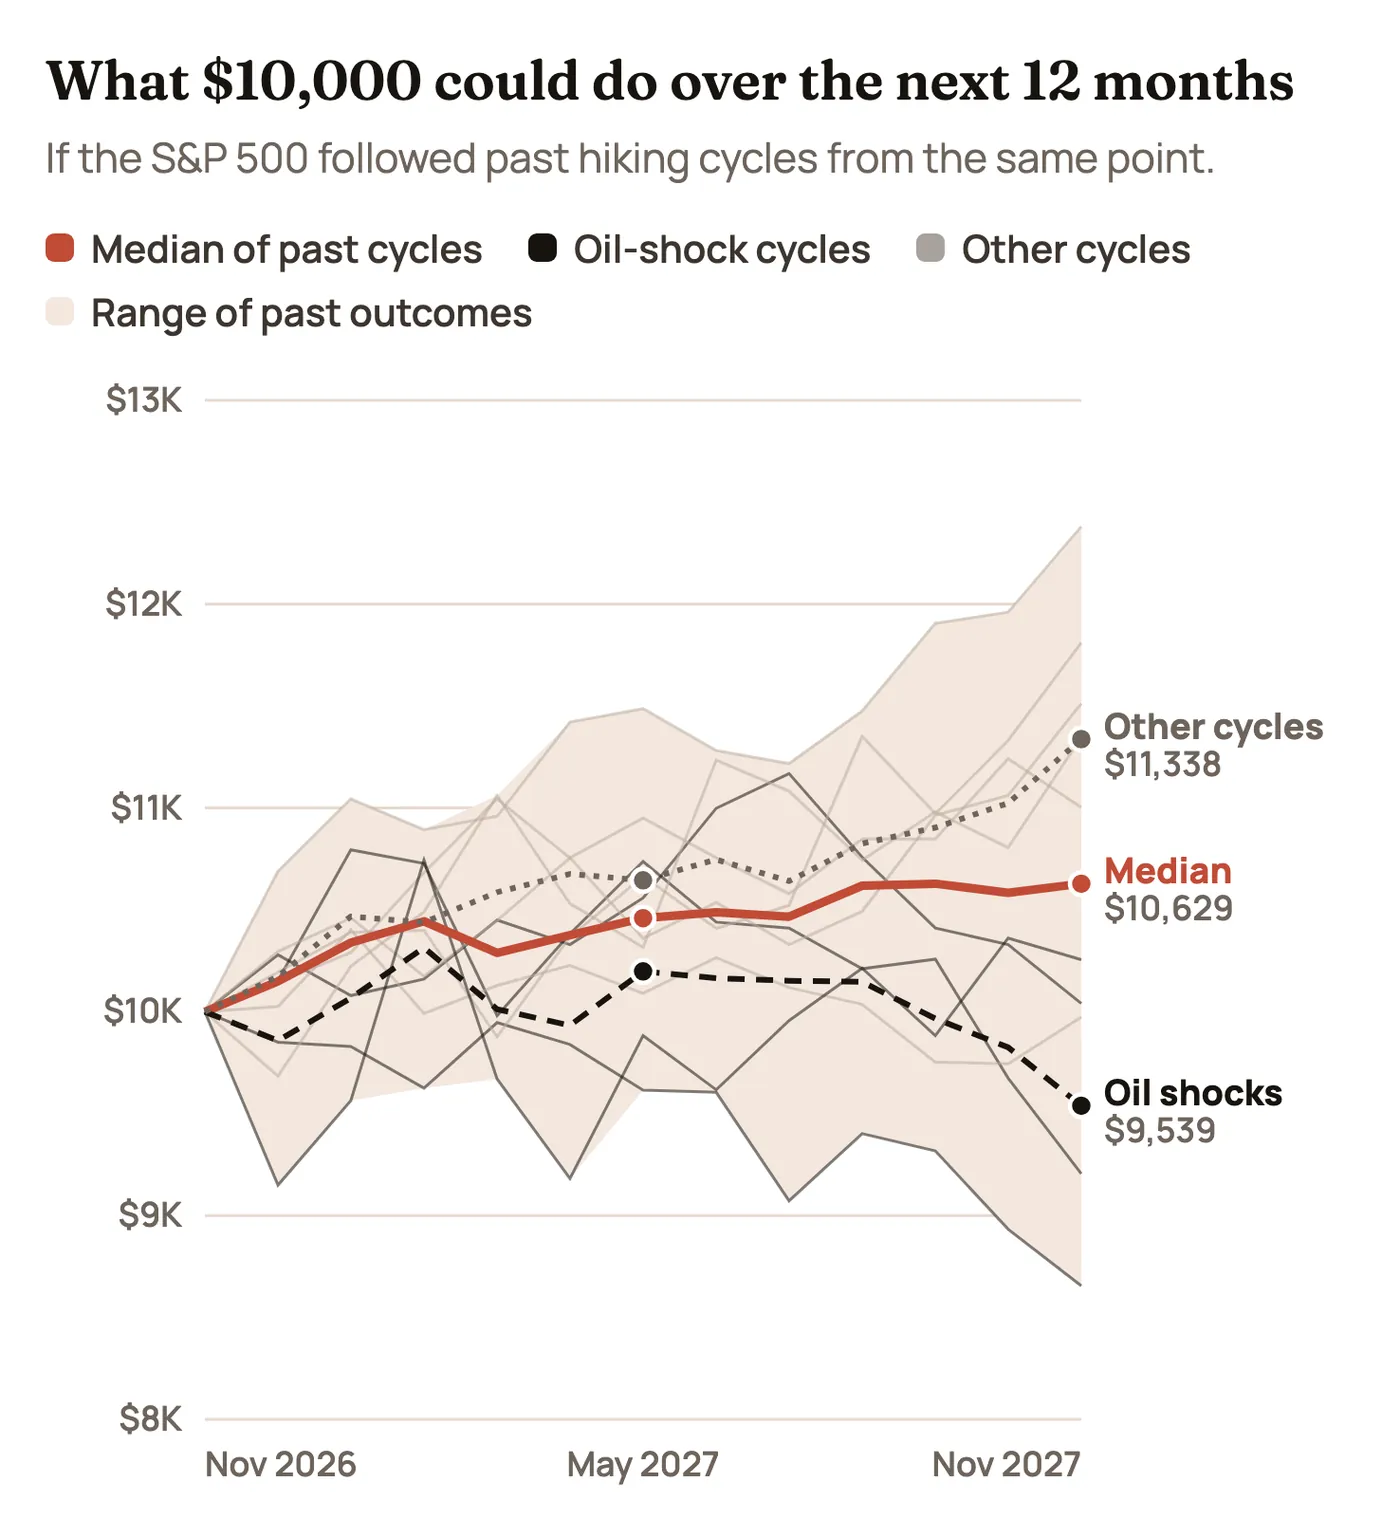
Starting from where we are now (about two months after the first hike), the median past cycle turned $10,000 into about $10,600 over the next year. The six cycles without an oil shock averaged about $11,300. The four oil-shock cycles averaged about $9,500. The full range ran from about $8,700 (1977) to about $12,400 (2015). That spread is the honest answer: how this goes depends mostly on whether 2026 ends up behaving like an oil-shock cycle or a normal one, and the next two inflation reports are the best clues.
The Calendar: What to Watch and When
| Date | Event | Why it matters |
| Nov. 13 | Producer prices (PPI) for October | Wholesale prices were up 6.3% from a year earlier in September. They often show up in consumer prices a few months later. |
| Late November | October PCE inflation (the Fed’s preferred measure) | Core PCE was 3.1% in the last report. Another hot reading would push the half-point odds up. |
| Early December | November jobs report | Strong hiring gives the Fed cover to hike more. |
| Dec. 8–9 | Fed meeting with new projections | The hike is expected. The size, and the “dot plot” of where officials see rates in 2027, are the real news. |
| Mid-December | November CPI | A fourth 0.3% core month in a row would put January firmly in play. |
| Jan. 26–27, 2027 | Fed meeting | Markets currently lean toward one more hike by March. This is the first chance. |
| Ongoing | Oil and the Strait of Hormuz | The single biggest swing factor for inflation. Brent above $110 again would change the picture fast. |
How to Use This
History doesn’t tell you what to buy. It does give you some useful habits for a market like this one:
- Expect the first few months to be bumpy. That’s the norm in 7 of 10 cycles, not a signal that something is broken.
- Watch inflation trends more than the Fed’s next move. The rallies in 1980, 1982, 1995 and 2023 all started when inflation was cooling, not when rates were low.
- Know which kind of oil spike you’re in. Demand-driven spikes have been fine for stocks. Supply shocks have not. Watch whether oil keeps falling as tensions ease.
- Respect valuations. Expensive markets have less room for error when bonds pay 5%. That doesn’t mean selling, but it’s a reason to know what you own and why.
- Remember that the end of the hikes is usually the opportunity. The best stretch in our data is the year after the last hike, not the year before it.
For the stocks most tied to these themes (energy, banks, homebuilders, utilities and the AI buildout), see Moves That Matter for the news, updated hourly, On Our Radar for what we’re watching, and our trades, updated hourly, for what we actually do.
The Bottom Line
Rising rates, 5% bond yields and expensive oil are a tough combination, and the first reaction to it is usually selling. But history says the reaction is often worse than the outcome. In most hiking cycles, stocks were higher a year later and higher still a year after the Fed stopped. The real danger has been the cycles where an oil shock pushed inflation up and kept it there, as in 1973 and 1979. 2026 has the oil shock. What it doesn’t have, so far, is inflation getting out of control: long-term expectations are steady and oil has already fallen back from its October peak. The next two inflation reports and the December Fed meeting will tell us a lot about which version of history we’re living through.
Market data as of November 9–10, 2026, and changes quickly. Past cycles are not a forecast, and the projection chart shows what history did, not what will happen. Nothing here is investment advice.
We don't currently earn commissions from links on this site. Nothing here is personalized investment advice; we are not licensed financial advisors. The authors may hold positions in securities we mention and may trade them at any time.