Stock MarketStock Memory LaneMarket HistoryLong-Term Investing
Stock Memory Lane: What Nearly 100 Years of the S&P 500, Nasdaq and Dow Teach Us

The short version: From the end of 1971 through 2025, $10,000 in the Nasdaq grew to about $2 million, roughly three times what the S&P 500 or the Dow delivered. It also lost 67% from 1999 to 2002 and took until 2013 to get back to even. Almost a century of returns says the same thing over and over: the long run has been very good, the ride has been rough, and most of the money shows up late.
Welcome to Stock Memory Lane, our corner for looking back at what the market actually did, not what we remember it doing. Markets have short memories, and so do investors. Every bull market feels like the new normal, and every crash feels like the end. A long table of yearly returns is a good cure for both.
This one starts with 98 years of returns, 1928 through 2025, for the three indexes everyone quotes. Every chart uses an even scale: each gridline is the same distance in real dollars or real percentage points, so nothing gets squeezed to make it look tidier than it was. Hover or tap any chart for the exact numbers.
First, what these three indexes are
- The S&P 500 tracks about 500 large U.S. companies, weighted by company size. It launched in its current form in 1957. The earlier years come from its smaller predecessor.
- The Nasdaq Composite holds the thousands of stocks listed on the Nasdaq exchange, and it leans heavily toward technology. It started in 1971, so its full-year record here begins in 1972.
- The Dow Jones Industrial Average is just 30 big blue-chip companies. It’s weighted by share price, not company size, which is an odd quirk: a stock with a higher share price moves the index more, however big the company is.
One important note before the numbers: these are price returns, with no dividends. That understates what investors actually earned, especially in the early decades when dividends were large. With dividends reinvested, the S&P 500 has returned roughly 10% a year since 1928, not the 6.3% you’ll see here. None of this is adjusted for inflation either.
The big race: 1972 to 2025
Fifty-four years is as far back as we can compare all three. Put $10,000 in each at the end of 1971 and leave it alone.
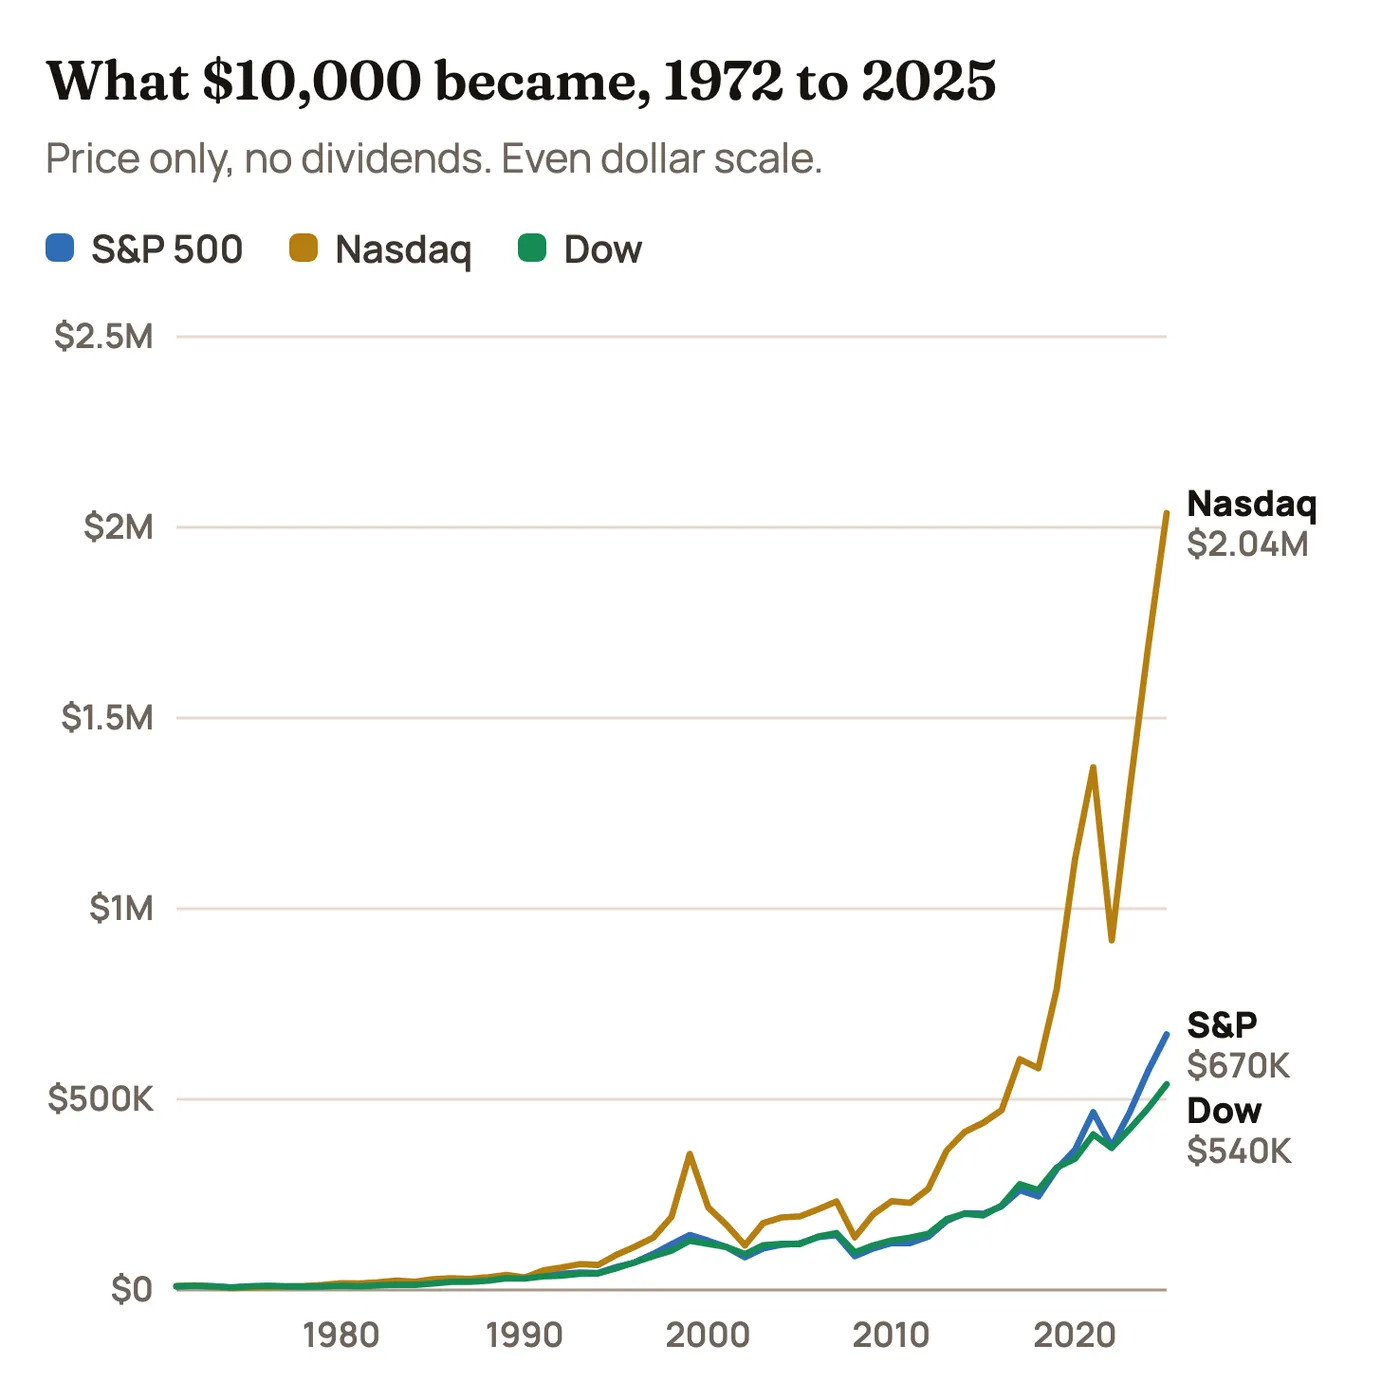
Look at where the money shows up. Those lines barely leave the floor for decades. The S&P 500 position was worth about $109,000 at the end of 2009 and about $670,000 at the end of 2025, so roughly 84% of the ending balance arrived in the last 16 of the 54 years. For the Nasdaq it’s about 90%. That is what compounding looks like on an honest scale. It’s dull for a very long time, and then it isn’t.
The flip side of an even scale: the S&P 500’s 19% drop in 2022 looks like a cliff, while its 30% drop in 1974 is barely a wiggle, because 2022 was many more dollars. In percentage terms, 1974 was worse. Keep that in mind when a recent chart looks scarier than an old one.
| 1972 to 2025 | S&P 500 | Nasdaq | Dow |
|---|---|---|---|
| $10,000 became | $670,400 | $2,037,008 | $539,906 |
| Compounded per year | 8.1% | 10.3% | 7.7% |
| Average single year | 9.5% | 13.5% | 8.8% |
| Typical swing (std. dev.) | 16.8% | 25.6% | 15.3% |
| Best year | +34.1% (1995) | +85.6% (1999) | +38.3% (1975) |
| Worst year | −38.5% (2008) | −40.5% (2008) | −33.8% (2008) |
| Down years | 13 of 54 | 14 of 54 | 15 of 54 |
| Worst drop (year-end closes) | −42% | −67% | −40% |
The Nasdaq won, but look at what it cost
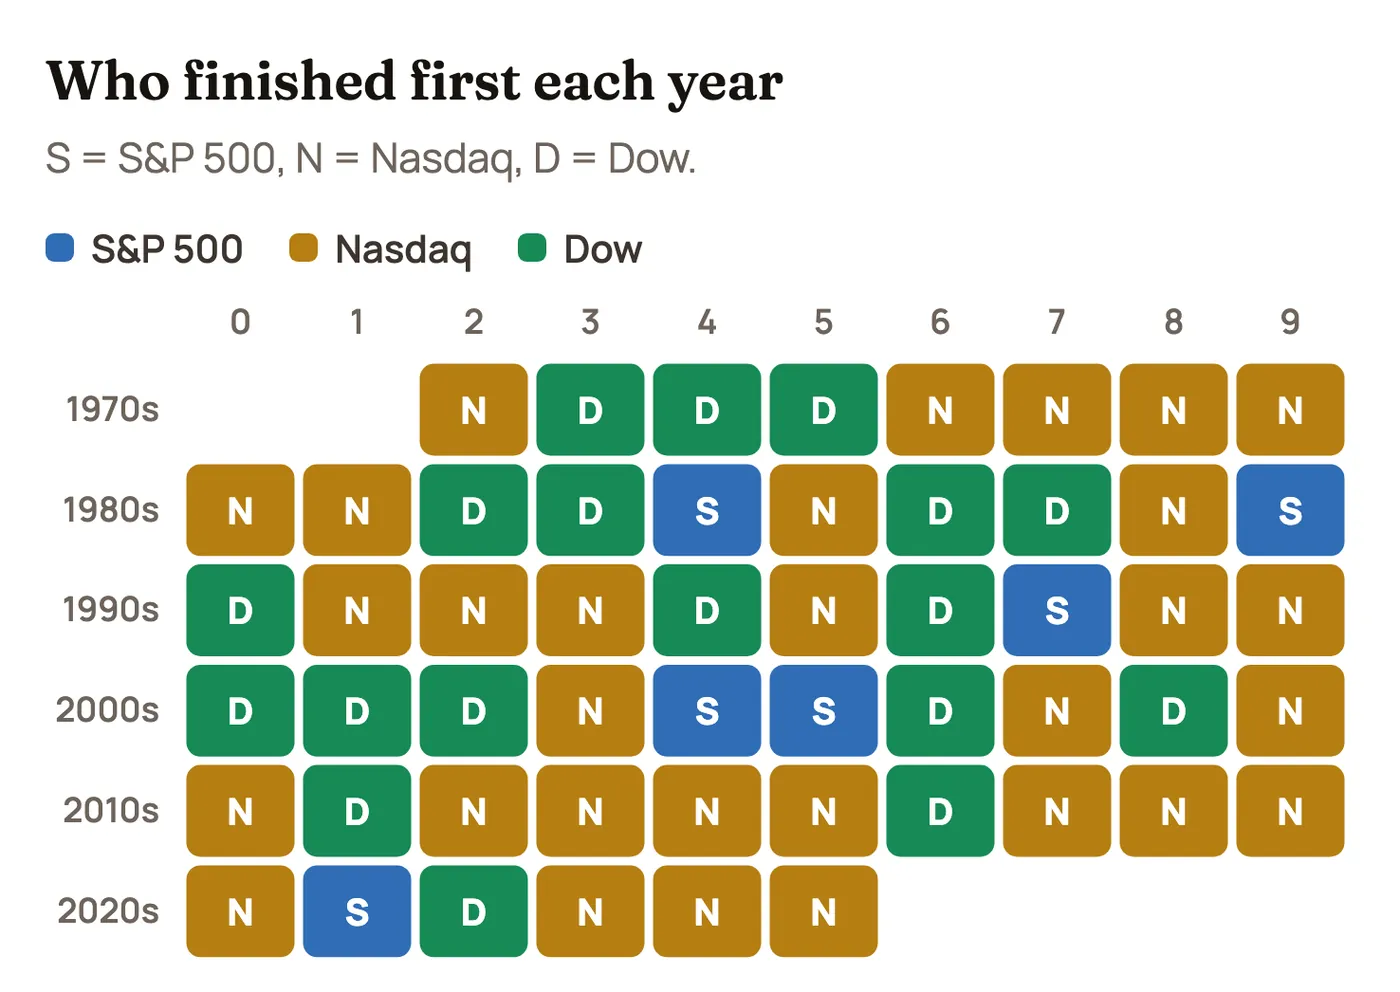
The Nasdaq finished first in 30 of the 54 years. The Dow took 18 and the S&P 500 just 6. It’s tempting to stop reading right there.
But the chart below shows the price of that lead. It plots how far each index sat below its previous high, using year-end closes. The deeper the line, the longer you waited and the more you had to sit through.
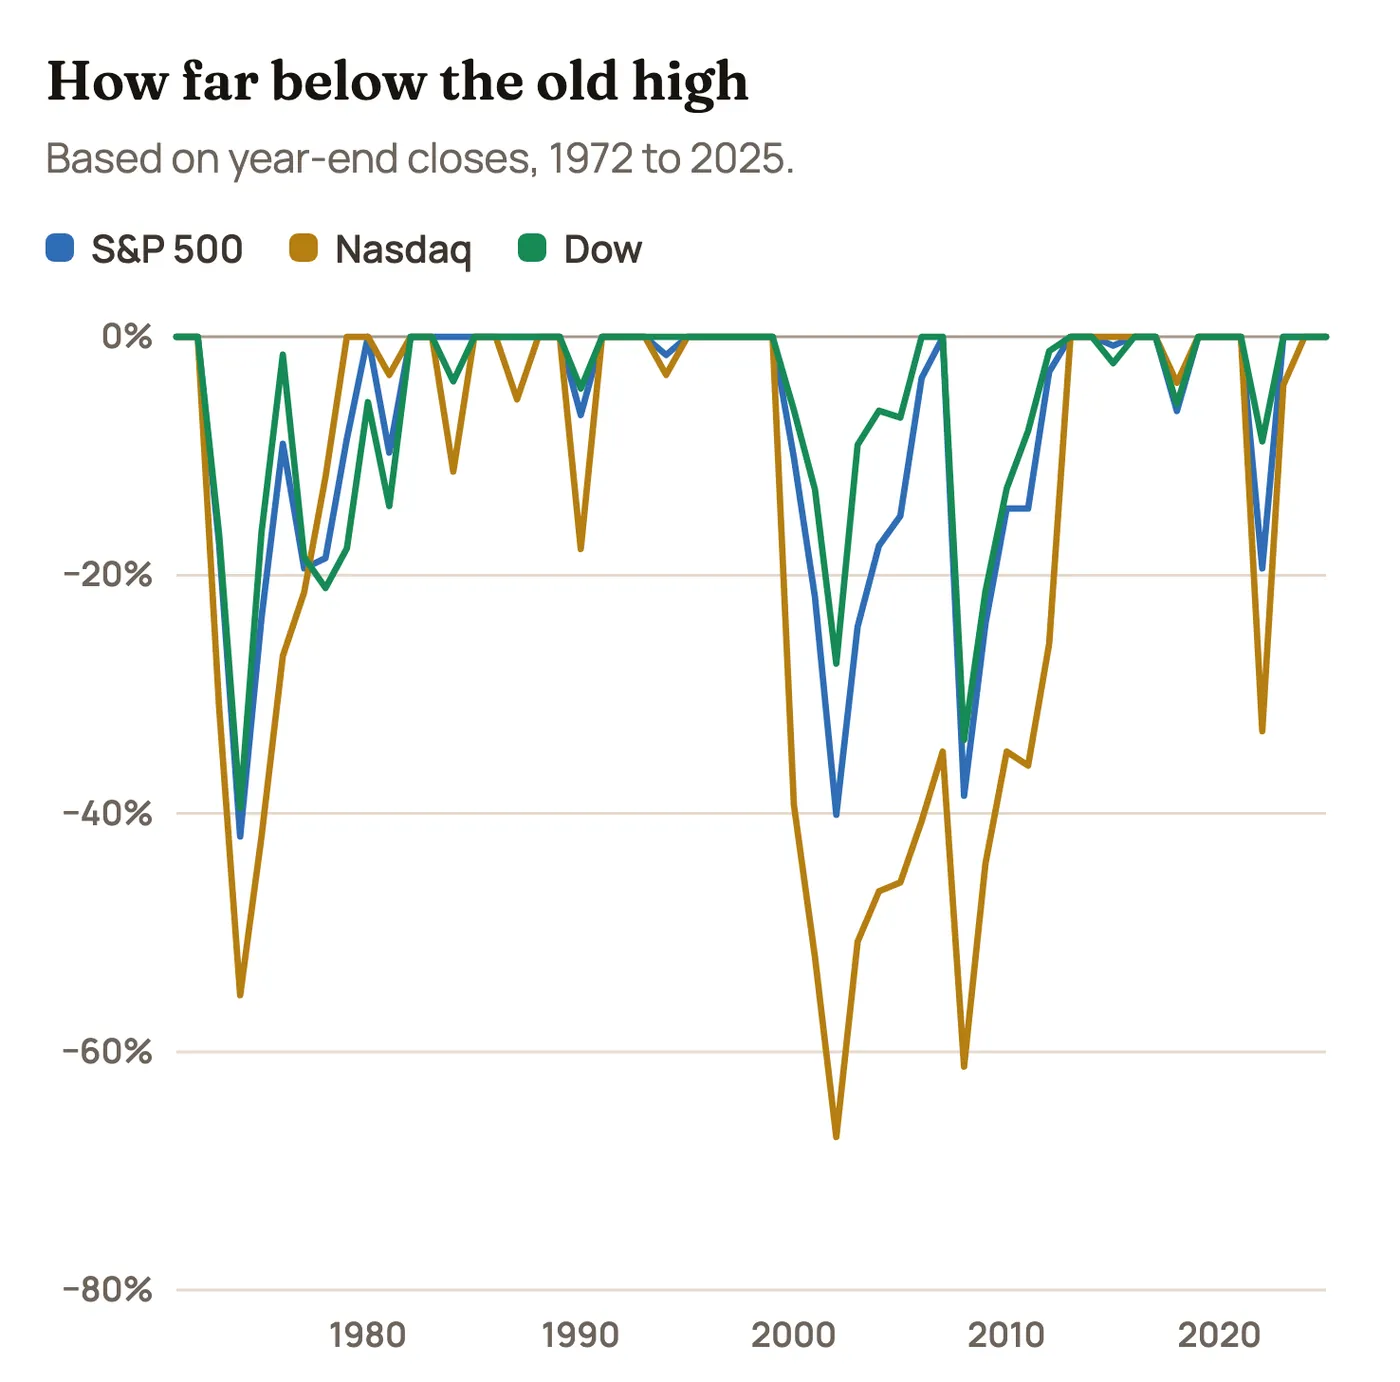
Someone who bought the Nasdaq at the end of 1999 was down 67% three years later and didn’t get back to even, on a year-end basis, until 2013. That’s 14 years with nothing to show for it, before dividends. The S&P 500 took just as long, since the 2008 crash hit before it had fully recovered. Measured from its actual peak in March 2000, the Nasdaq’s wait was longer still, into 2015. The Dow, with little dot-com froth in it, was back by 2006 before 2008 knocked it down again.
The lead also depends heavily on when you measure. From 1972 through 2009, the Nasdaq’s $10,000 was worth about $199,000 against about $109,000 for the S&P 500 and $117,000 for the Dow. Most of the gap you see on the big chart came after that.
Averages flatter everyone
Here’s a trick to spot in any return claim. The Nasdaq’s average year from 1972 through 2025 was 13.5%, but your money actually compounded at 10.3%. The S&P 500’s average was 9.5% against 8.1% compounded. The Dow’s was 8.8% against 7.7%.
The gap comes from volatility. Lose 50% and gain 50%, and the average says you’re flat, but you’re actually down 25%. The bigger the swings, the bigger the gap between the average and what you actually keep. We wrote a whole piece on this math in The Asymmetry of Loss.
The “average year” barely exists, either. Here’s every S&P 500 year since 1928.
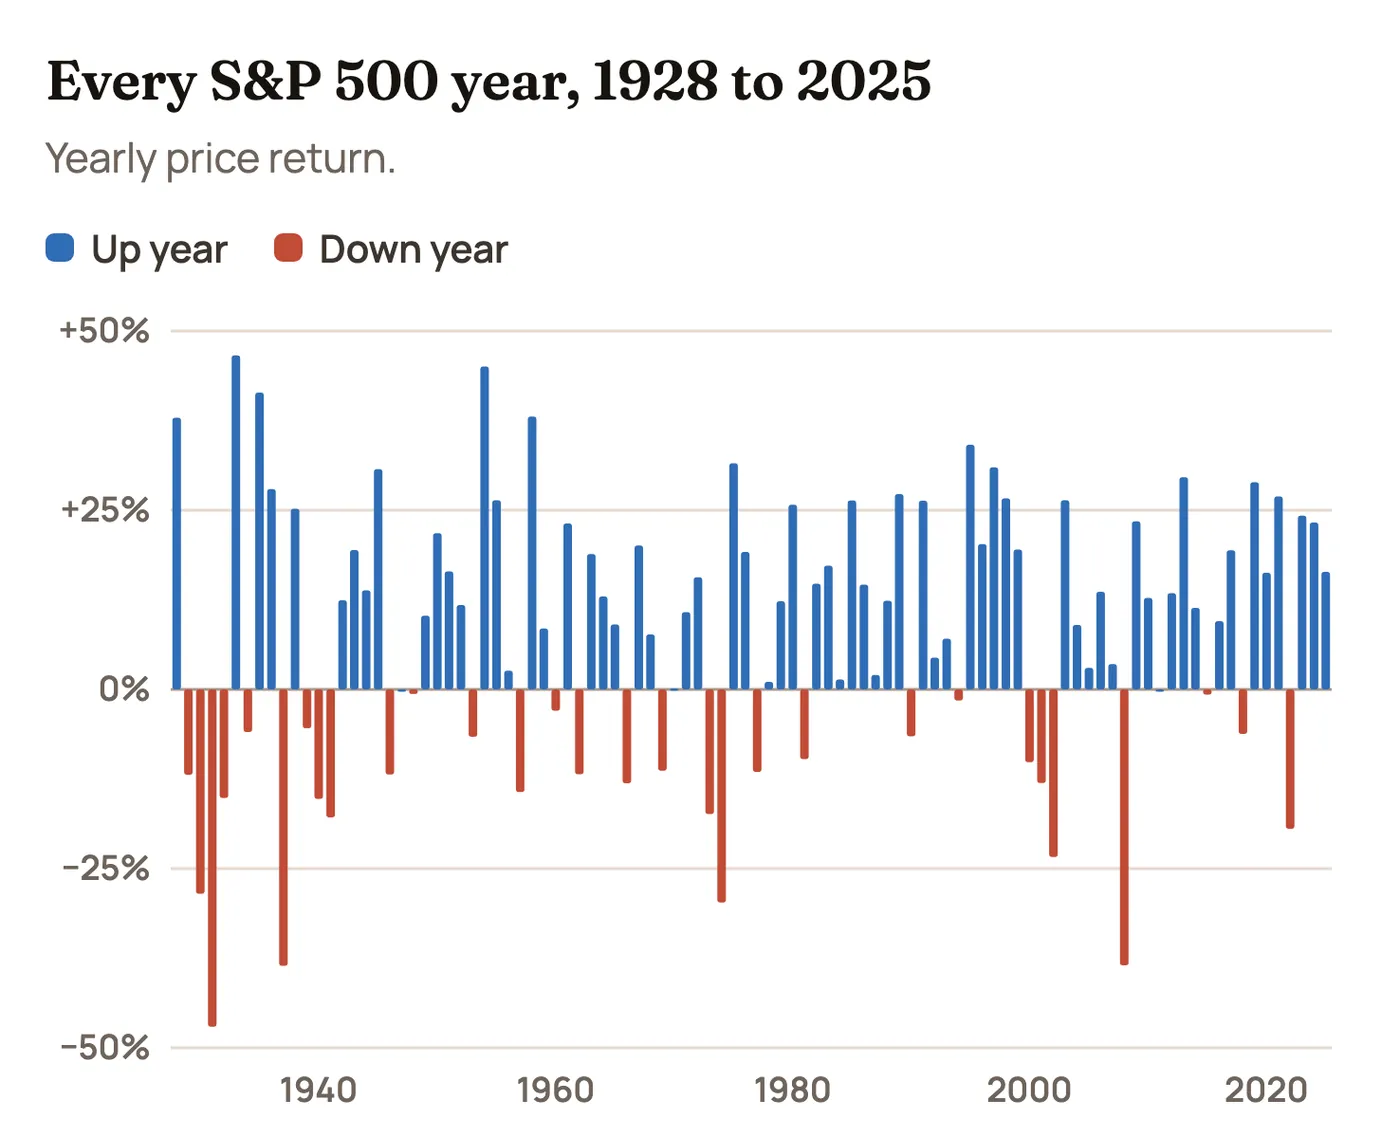
The average is about 8%, yet only 6 of the 98 years landed within two points of it. The S&P 500 rose 20% or more in 28 of those years and fell in 30. A down year is not a rare event. It has happened about three years out of every ten. And 21 of those 30 down years were followed by an up year.
The S&P 500 and the Dow are nearly twins
Their yearly returns have a 0.95 correlation since 1972, which means they tend to move together. Over those 54 years, the S&P 500 compounded about 0.4 points a year faster. That sounds like nothing, but it adds up to about 24% more money at the end. Small differences matter when they run for decades.
Lately the gap has been bigger. From 2020 through 2025 the Dow compounded at 9.1% a year against 13.3% for the S&P 500 and 17.2% for the Nasdaq, largely because the Dow’s 30 stocks hold less of the giant tech companies that have led the market.
A walk through the decades
The long-run average hides how different each decade felt.
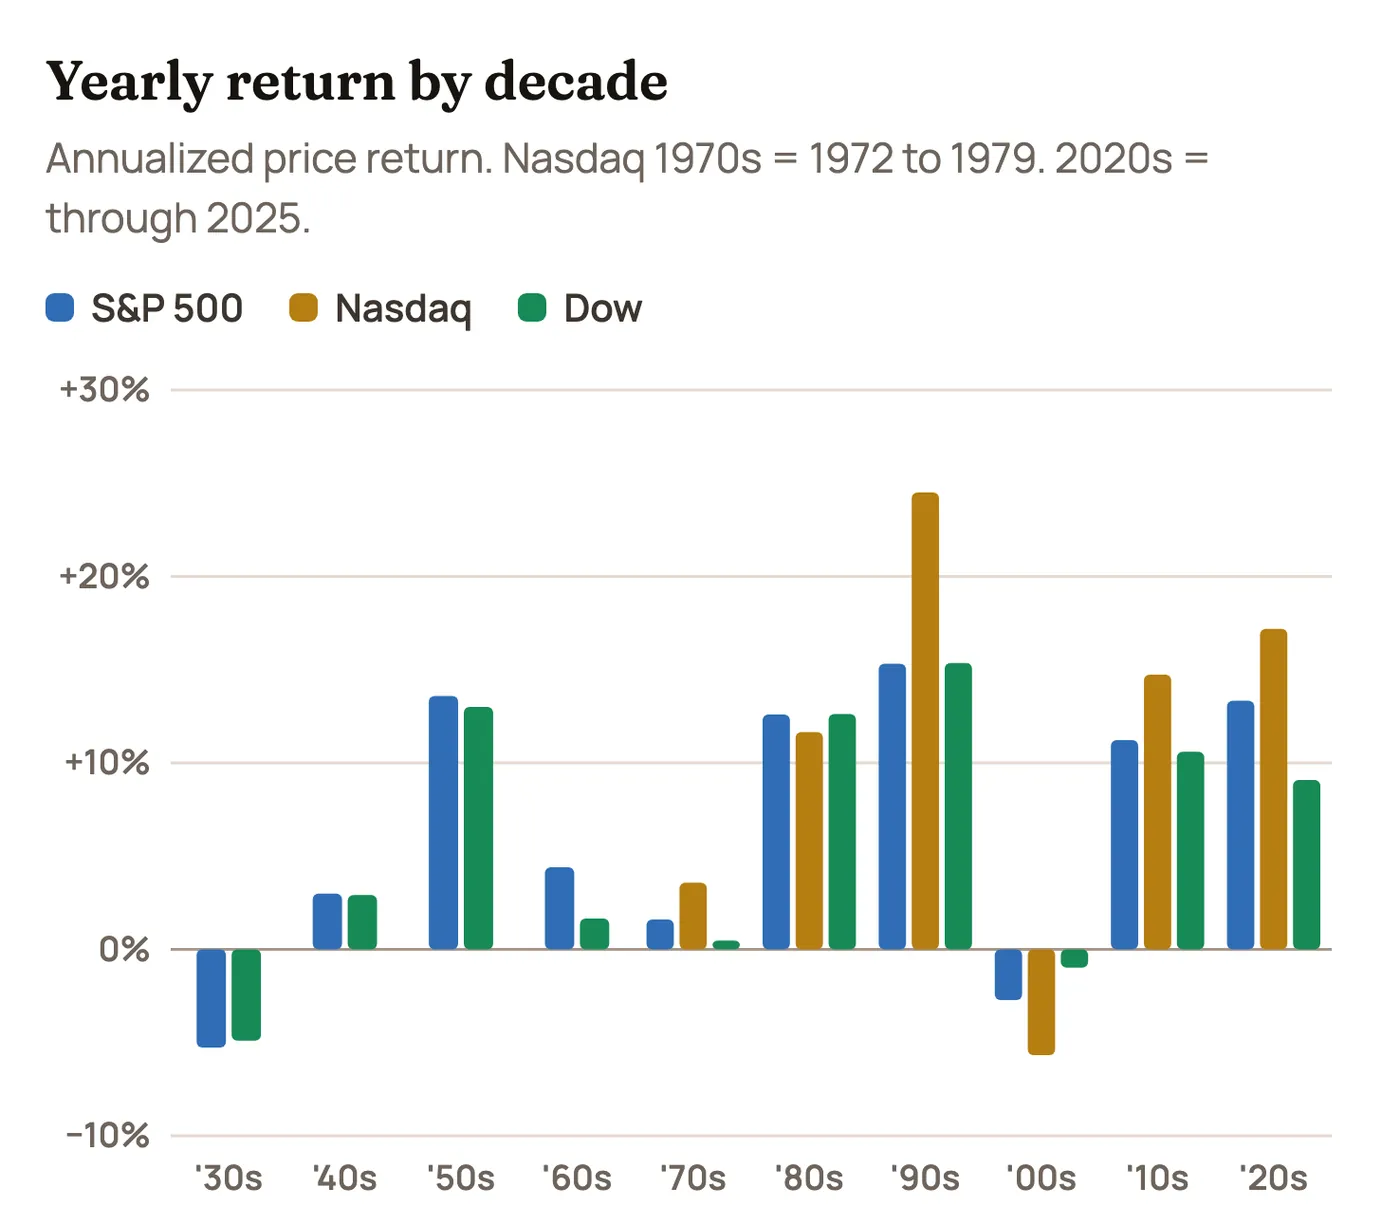
| Decade | S&P 500 | Nasdaq | Dow |
|---|---|---|---|
| 1930s | −5.3% | n/a | −4.9% |
| 1940s | +3.0% | n/a | +2.9% |
| 1950s | +13.6% | n/a | +13.0% |
| 1960s | +4.4% | n/a | +1.7% |
| 1970s | +1.6% | +3.6% (from 1972) | +0.5% |
| 1980s | +12.6% | +11.6% | +12.6% |
| 1990s | +15.3% | +24.5% | +15.4% |
| 2000s | −2.7% | −5.7% | −1.0% |
| 2010s | +11.2% | +14.7% | +10.6% |
| 2020s (through 2025) | +13.3% | +17.2% | +9.1% |
The Depression. From the end of 1928 to the end of 1932, the S&P 500 fell 72% and the Dow 80%. On a price basis the S&P didn’t close a year above that 1928 level until 1952, and the Dow not until 1954. That’s 24 and 26 years. Dividends softened this a lot, but it’s the reason an entire generation stayed away from stocks.
The 1950s. The best decade the S&P 500 ever had on a price basis outside the 1990s, at 13.6% a year, helped by the postwar boom. It began when most people still remembered the Depression and didn’t trust the market. The returns came anyway.
The 1960s and 1970s. A good start, then inflation. Prices went almost nowhere: the S&P 500 gained 1.6% a year in the 1970s and the Dow just 0.5%, while inflation ran high. After inflation, that decade was a real loss. The worst of it was 1973 and 1974, when the S&P 500 lost 42%.
The 1980s and 1990s. The best stretch in the table. Falling inflation and falling rates lifted everything, and the 1990s Nasdaq compounded at a remarkable 24.5% a year, capped by that 85.6% gain in 1999.
The 2000s. The “lost decade.” Two crashes in ten years. $10,000 in the S&P 500 at the end of 1999 was $7,588 ten years later. In the Nasdaq it was $5,576. The market’s most exciting decade was followed immediately by its worst modern one.
Since 2010. A long run led by the biggest tech companies, broken by a quick 2020 crash that doesn’t even show up as a down year, and by 2022’s rate shock. From 2010 through 2025 the S&P 500 compounded at 12.0% a year, the Nasdaq at 15.7% and the Dow at 10.0%. Those years feel normal now. So did the 1990s at the time.
And right now: 2026 so far, as of November 6: S&P 500 +7.8%, Nasdaq +6.0%, Dow +6.6%. That’s a partial year, measured through funds that track each index, so it stays out of the charts and tables here until the year is complete.
Time in the market, measured
This is the part that convinces us most. The longer you hold, the narrower the range of outcomes gets.
| 1972 to 2025 | S&P 500 | Nasdaq | Dow |
|---|---|---|---|
| Worst 5-year stretch, per year | −4.2% | −11.8% | −4.0% |
| Best 5-year stretch, per year | +26.2% | +40.2% | +24.6% |
| Worst 10-year stretch, per year | −3.0% | −5.7% | −1.0% |
| Best 10-year stretch, per year | +16.0% | +24.5% | +15.5% |
| Worst 20-year stretch, per year | +3.6% | +4.0% | +4.7% |
| Best 20-year stretch, per year | +13.9% | +17.9% | +14.0% |
Since 1972, no 20-year stretch has lost money on any of the three indexes, even before dividends. The same can’t quite be said going back to 1928: for both the S&P 500 and the Dow, 3 of the 79 possible 20-year stretches lost money on a price basis, all of them starting right around the 1929 peak. Ten-year losses are more common, at 12 of 89 stretches for each. So ten years is not automatically “long term.” History says it can take longer than that.
Here’s that longest view, again on an even scale.
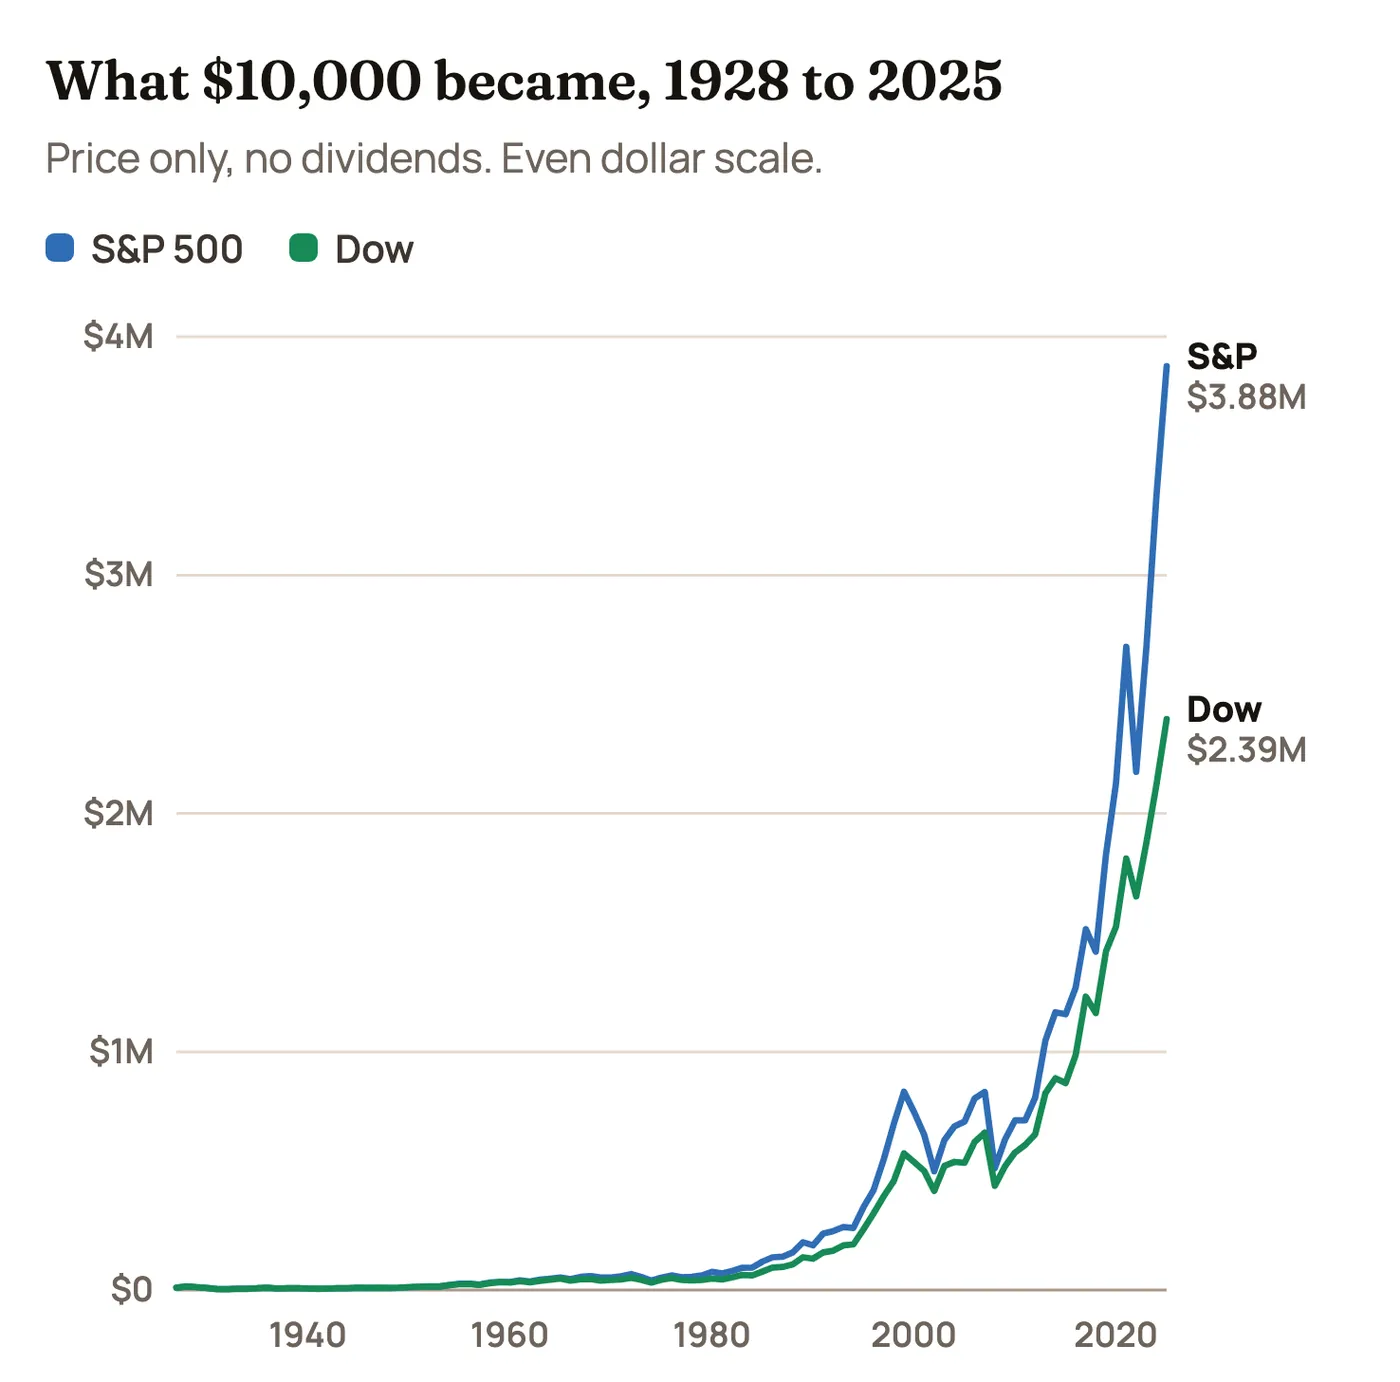
Eighteen years in, at the end of 1945, that $10,000 was still worth only about $9,800 in the S&P 500. It finished at about $3.9 million. Both of those facts are true, and you need to believe both of them to invest well.
The years one index ran away with it
Most years the three finish fairly close together. These are the 21 years when the winner beat second place by at least 7 points. The Nasdaq has 13 of them, the Dow 6 and the S&P 500 2. Before 1972, it’s only the S&P 500 against the Dow.
The Nasdaq’s big wins tend to come in speculative booms or in sharp rebounds after a crash. The Dow and the S&P 500 often win by losing less, when rates spike or investors run for safety. The reasons below are our best reading of what was going on. Markets rarely have just one cause, so treat these as arguments, not facts.
2023: Nasdaq by 19.2 points
S&P 500 +24.2% · Nasdaq +43.4% · Dow +13.7%
The AI boom. ChatGPT turned artificial intelligence into the story of the year, and a small group of giant tech companies, led by NVIDIA, drove most of the gain. It was also a rebound from the beating those same stocks took in 2022.
2022: Dow by 10.7 points
S&P 500 −19.4% · Nasdaq −33.1% · Dow −8.8%
The rate shock. Inflation hit about 9% and the Federal Reserve raised rates faster than it had in decades. Higher rates hit growth stocks hardest. The Dow’s older, cash-generating companies fell the least, so it won by losing less.
2020: Nasdaq by 27.4 points
S&P 500 +16.3% · Nasdaq +43.6% · Dow +7.2%
The pandemic. Lockdowns moved work, shopping and entertainment online, which played straight to tech companies. Near-zero interest rates and huge stimulus added fuel. Banks and industrial companies, which matter more to the Dow, lagged badly.
2013: Nasdaq by 8.7 points
S&P 500 +29.6% · Nasdaq +38.3% · Dow +26.5%
Easy money. The Fed was still buying bonds, investors grew comfortable taking risk again, and biotech and internet stocks led. All three indexes had a great year. The Nasdaq simply had the most of what people wanted.
2009: Nasdaq by 20.4 points
S&P 500 +23.4% · Nasdaq +43.9% · Dow +18.8%
The bounce off the bottom. Stocks hit their low in March after the financial crisis, and the Fed held rates near zero. Tech companies had little of the debt trouble that hurt banks, and beaten-down names rebounded the fastest.
2003: Nasdaq by 23.6 points
S&P 500 +26.4% · Nasdaq +50.0% · Dow +25.3%
The bounce after the dot-com bust. After three brutal years, the Fed cut rates to 1% and the economy recovered. Battered tech stocks had the most room to recover and snapped back hardest.
1999: Nasdaq by 60.4 points
S&P 500 +19.5% · Nasdaq +85.6% · Dow +25.2%
Peak dot-com. Internet IPOs could double on their first day, and Y2K spending added to the tech rush. This is the best year for any index in the whole table. The next three years gave back far more than this one made.
1998: Nasdaq by 13.0 points
S&P 500 +26.7% · Nasdaq +39.6% · Dow +16.1%
Big tech through a scare. Russia’s default and the collapse of the hedge fund Long-Term Capital Management shook markets that fall. The Fed cut rates three times, and money rushed back into large tech names like Microsoft and Cisco.
1997: S&P 500 by 8.4 points
S&P 500 +31.0% · Nasdaq +21.6% · Dow +22.6%
Large companies in favor. Investors paid up for big, steady S&P names, while the Asian financial crisis that fall hit chipmakers and exporters. It’s one of the few years the S&P 500 came out clearly on top.
1992: Nasdaq by 11.0 points
S&P 500 +4.5% · Nasdaq +15.4% · Dow +4.2%
Small companies recover. The Fed kept cutting rates as the economy slowly came out of recession. Smaller growth stocks responded, while the blue chips barely moved.
1991: Nasdaq by 30.6 points
S&P 500 +26.3% · Nasdaq +56.9% · Dow +20.3%
Recovery and rate cuts. The Gulf War ended, the recession faded and rates kept falling. Biotech and PC-era tech stocks soared after a rough 1990.
1986: Dow by 8.0 points
S&P 500 +14.6% · Nasdaq +7.4% · Dow +22.6%
The blue-chip year. Falling oil prices and falling rates helped big industrial companies, and takeover fever was in the air. Smaller Nasdaq companies got left behind.
1980: Nasdaq by 8.1 points
S&P 500 +25.8% · Nasdaq +33.9% · Dow +14.9%
Energy and tech. Oil-related and technology stocks surged in a year of high inflation, and Reagan’s election lifted spirits late in the year. Those sectors had more weight in the smaller companies on the Nasdaq.
1979: Nasdaq by 15.8 points
S&P 500 +12.3% · Nasdaq +28.1% · Dow +4.2%
Oil shock, small-stock run. The Iranian revolution pushed oil higher, and rising inflation and rates kept weighing on the old blue chips. Smaller companies, including energy names, kept up their multiyear run.
1978: Nasdaq by 11.2 points
S&P 500 +1.1% · Nasdaq +12.3% · Dow −3.1%
Small stocks keep going. Inflation and rising rates held back big companies while investors kept favoring smaller growth stocks. The Dow actually lost money in a year the Nasdaq rose double digits.
1977: Nasdaq by 18.8 points
S&P 500 −11.5% · Nasdaq +7.3% · Dow −17.3%
The “Nifty Fifty” hangover. Rising inflation and interest rates pushed down the large companies that had been so loved in the early 1970s. Smaller, overlooked companies began a long run of beating them.
1959: Dow by 7.9 points
S&P 500 +8.5% · Dow +16.4%
Late-1950s industrial boom. Industrial and consumer companies kept rising while higher Treasury yields weighed on the utilities and financial stocks that are part of the broader S&P. This explanation is debatable.
1934: Dow by 10.1 points
S&P 500 −5.9% · Dow +4.1%
Recovery stalls. The first New Deal surge faded and the new SEC took over market oversight. The Dow’s narrow list held up while the broader index slipped. This explanation is debatable.
1933: Dow by 20.1 points
S&P 500 +46.6% · Dow +66.7%
New Deal reflation. The bank holiday, leaving the gold standard and New Deal spending set off a violent rebound. The Dow’s beaten-down heavy industrial companies bounced the hardest.
1932: S&P 500 by 7.9 points
S&P 500 −15.2% · Dow −23.1%
The bottom of the Depression. Stocks finally hit their low that July. The Dow’s concentration in cyclical industrial companies meant deeper losses, so the broader index “won” by falling less.
1928: Dow by 11.6 points
S&P 500 +37.9% · Dow +49.5%
Roaring Twenties speculation. Buying on borrowed money poured into a handful of famous, high-priced names, and the Dow’s price weighting amplified them. The crash came the next year.
Some near misses are worth knowing. In 2024 the Nasdaq led by 5.3 points. In 2000 through 2002 no index “won” by much at all, but the Nasdaq lost far more than the other two.
What we take from all this
- Your time horizon matters more than your index. Which index won depends a lot on when you look. Staying invested through the bad stretches has mattered more.
- Higher returns came with worse drops. The Nasdaq’s lead is real, and so is the 14-year hole. Only take a ride you can sit through without selling at the bottom.
- Don’t judge a return by its average. Ask what it compounded at. Those numbers can be very different.
- Expect down years. About three in ten. A rough year isn’t a sign that something has broken.
- The boring years do the work. So much of the ending balance shows up at the very end. That only pays people who are still there.
- The hot decade rarely repeats. The 1990s’ favorite was the 2000s’ biggest loser. Today’s favorite doesn’t get a free pass from history. This is part of why we like to ring the register now and then.
Every year, 1928 to 2025
The full table, so you can check any of the numbers above or look up the year you started investing.
| Year | S&P 500 | Nasdaq | Dow | Top |
|---|---|---|---|---|
| 2025 | +16.39% | +20.36% | +12.97% | Nasdaq |
| 2024 | +23.31% | +28.64% | +12.88% | Nasdaq |
| 2023 | +24.23% | +43.42% | +13.70% | Nasdaq |
| 2022 | −19.44% | −33.10% | −8.78% | Dow |
| 2021 | +26.89% | +21.39% | +18.73% | S&P 500 |
| 2020 | +16.26% | +43.64% | +7.25% | Nasdaq |
| 2019 | +28.88% | +35.23% | +22.34% | Nasdaq |
| 2018 | −6.24% | −3.88% | −5.63% | Nasdaq |
| 2017 | +19.42% | +28.24% | +25.08% | Nasdaq |
| 2016 | +9.54% | +7.50% | +13.42% | Dow |
| 2015 | −0.73% | +5.73% | −2.23% | Nasdaq |
| 2014 | +11.39% | +13.40% | +7.52% | Nasdaq |
| 2013 | +29.60% | +38.32% | +26.50% | Nasdaq |
| 2012 | +13.41% | +15.91% | +7.26% | Nasdaq |
| 2011 | 0.00% | −1.80% | +5.53% | Dow |
| 2010 | +12.78% | +16.91% | +11.02% | Nasdaq |
| 2009 | +23.45% | +43.89% | +18.82% | Nasdaq |
| 2008 | −38.49% | −40.54% | −33.84% | Dow |
| 2007 | +3.53% | +9.81% | +6.43% | Nasdaq |
| 2006 | +13.62% | +9.52% | +16.29% | Dow |
| 2005 | +3.00% | +1.37% | −0.61% | S&P 500 |
| 2004 | +8.99% | +8.59% | +3.15% | S&P 500 |
| 2003 | +26.38% | +50.01% | +25.32% | Nasdaq |
| 2002 | −23.37% | −31.53% | −16.76% | Dow |
| 2001 | −13.04% | −21.05% | −7.10% | Dow |
| 2000 | −10.14% | −39.29% | −6.17% | Dow |
| 1999 | +19.53% | +85.59% | +25.22% | Nasdaq |
| 1998 | +26.67% | +39.63% | +16.10% | Nasdaq |
| 1997 | +31.01% | +21.64% | +22.64% | S&P 500 |
| 1996 | +20.26% | +22.71% | +26.01% | Dow |
| 1995 | +34.11% | +39.92% | +33.45% | Nasdaq |
| 1994 | −1.54% | −3.20% | +2.14% | Dow |
| 1993 | +7.06% | +14.75% | +13.72% | Nasdaq |
| 1992 | +4.46% | +15.45% | +4.17% | Nasdaq |
| 1991 | +26.31% | +56.86% | +20.32% | Nasdaq |
| 1990 | −6.56% | −17.81% | −4.34% | Dow |
| 1989 | +27.25% | +19.24% | +26.96% | S&P 500 |
| 1988 | +12.40% | +15.40% | +11.85% | Nasdaq |
| 1987 | +2.03% | −5.25% | +2.26% | Dow |
| 1986 | +14.62% | +7.36% | +22.58% | Dow |
| 1985 | +26.33% | +31.49% | +27.66% | Nasdaq |
| 1984 | +1.40% | −11.31% | −3.74% | S&P 500 |
| 1983 | +17.27% | +19.87% | +20.27% | Dow |
| 1982 | +14.76% | +18.67% | +19.60% | Dow |
| 1981 | −9.73% | −3.21% | −9.23% | Nasdaq |
| 1980 | +25.77% | +33.88% | +14.93% | Nasdaq |
| 1979 | +12.31% | +28.11% | +4.19% | Nasdaq |
| 1978 | +1.06% | +12.31% | −3.15% | Nasdaq |
| 1977 | −11.50% | +7.33% | −17.27% | Nasdaq |
| 1976 | +19.15% | +26.10% | +17.86% | Nasdaq |
| 1975 | +31.55% | +29.76% | +38.32% | Dow |
| 1974 | −29.72% | −35.11% | −27.57% | Dow |
| 1973 | −17.37% | −31.06% | −16.58% | Dow |
| 1972 | +15.63% | +17.18% | +14.58% | Nasdaq |
| 1971 | +10.79% | n/a | +6.11% | S&P 500 |
| 1970 | +0.10% | n/a | +4.82% | Dow |
| 1969 | −11.36% | n/a | −15.19% | S&P 500 |
| 1968 | +7.66% | n/a | +4.27% | S&P 500 |
| 1967 | +20.09% | n/a | +15.20% | S&P 500 |
| 1966 | −13.09% | n/a | −18.94% | S&P 500 |
| 1965 | +9.06% | n/a | +10.88% | Dow |
| 1964 | +12.97% | n/a | +14.57% | Dow |
| 1963 | +18.89% | n/a | +17.00% | S&P 500 |
| 1962 | −11.81% | n/a | −10.81% | Dow |
| 1961 | +23.13% | n/a | +18.71% | S&P 500 |
| 1960 | −2.97% | n/a | −9.34% | S&P 500 |
| 1959 | +8.48% | n/a | +16.40% | Dow |
| 1958 | +38.06% | n/a | +33.96% | S&P 500 |
| 1957 | −14.31% | n/a | −12.77% | Dow |
| 1956 | +2.62% | n/a | +2.27% | S&P 500 |
| 1955 | +26.40% | n/a | +20.77% | S&P 500 |
| 1954 | +45.02% | n/a | +43.96% | S&P 500 |
| 1953 | −6.62% | n/a | −3.77% | Dow |
| 1952 | +11.78% | n/a | +8.42% | S&P 500 |
| 1951 | +16.46% | n/a | +14.37% | S&P 500 |
| 1950 | +21.78% | n/a | +17.63% | S&P 500 |
| 1949 | +10.26% | n/a | +12.88% | Dow |
| 1948 | −0.65% | n/a | −2.13% | S&P 500 |
| 1947 | 0.00% | n/a | +2.23% | Dow |
| 1946 | −11.87% | n/a | −8.14% | Dow |
| 1945 | +30.72% | n/a | +26.65% | S&P 500 |
| 1944 | +13.80% | n/a | +12.09% | S&P 500 |
| 1943 | +19.45% | n/a | +13.81% | S&P 500 |
| 1942 | +12.43% | n/a | +7.61% | S&P 500 |
| 1941 | −17.86% | n/a | −15.38% | Dow |
| 1940 | −15.29% | n/a | −12.72% | Dow |
| 1939 | −5.45% | n/a | −2.92% | Dow |
| 1938 | +25.21% | n/a | +28.06% | Dow |
| 1937 | −38.59% | n/a | −32.82% | Dow |
| 1936 | +27.92% | n/a | +24.82% | S&P 500 |
| 1935 | +41.37% | n/a | +38.53% | S&P 500 |
| 1934 | −5.94% | n/a | +4.14% | Dow |
| 1933 | +46.59% | n/a | +66.69% | Dow |
| 1932 | −15.15% | n/a | −23.07% | S&P 500 |
| 1931 | −47.07% | n/a | −52.67% | S&P 500 |
| 1930 | −28.48% | n/a | −33.77% | S&P 500 |
| 1929 | −11.91% | n/a | −17.17% | S&P 500 |
| 1928 | +37.88% | n/a | +49.48% | Dow |
About the data: yearly price returns, not including dividends, fees, taxes or inflation. The Nasdaq Composite begins in 1972 here. Drops and recoveries use year-end closes, so the intraday extremes were somewhat worse. Past returns don’t predict future returns.
We don't currently earn commissions from links on this site. Nothing here is personalized investment advice; we are not licensed financial advisors. The authors may hold positions in securities we mention and may trade them at any time.